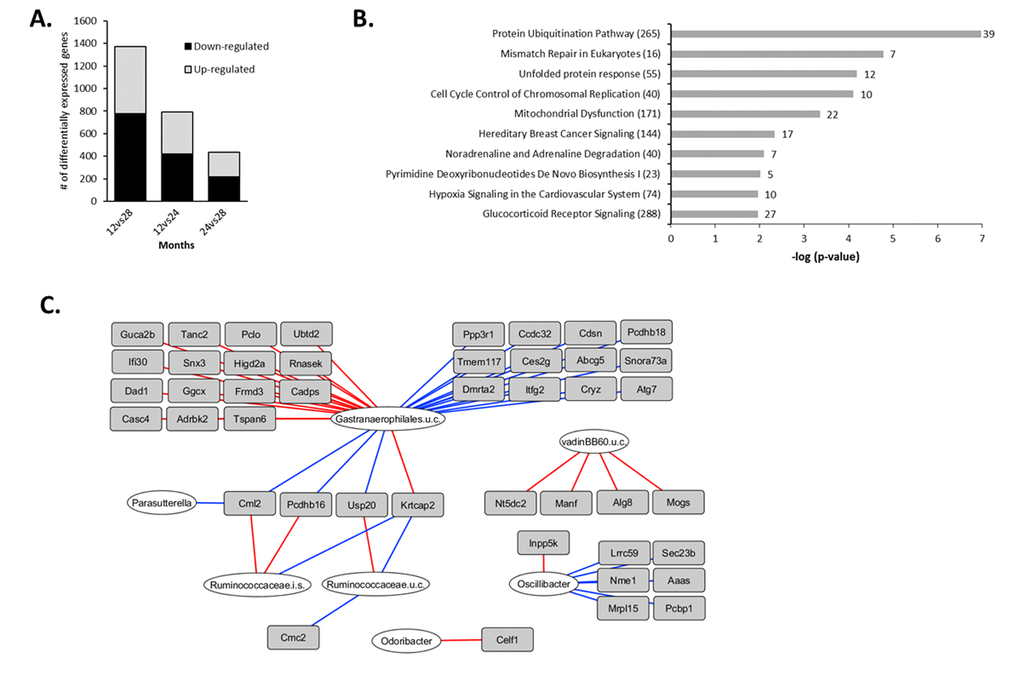
Figure 4.Aging-specific changes in colonic gene expression between 12 and 28 months and integration with colonic microbiota composition. (A) Number of differentially expressed genes between 12vs28, 12vs24 and 24vs28 months (IBMT p<0.01). (B) Top 10 most significant canonical pathways between 12 and 28 months identified by Ingenuity Pathway Analysis (IPA). Numbers behind bars represent the number of differentially expressed genes (IBMT p<0.01) and numbers behind the pathways represent the total number of genes. (C) Correlations between colonic microbiota composition and gene expression during aging. The 1371 genes differentially expressed between 12 and 28 months were correlated with the 50 genera with a relative abundance ≥0.1% in at least 1 sample, including the mice aged 12 and 28 months. Relevance network showing the genera (white circles) and genes (grey rectangles) that were correlated (r<-0.80 or r>0.80). Red lines represent positive correlations, blue lines represent negative correlations. For visualization purposes, only the top 25 strongest positive top 25 negative correlations are shown. i.s.=incertae sedis; u.c.: uncultured.