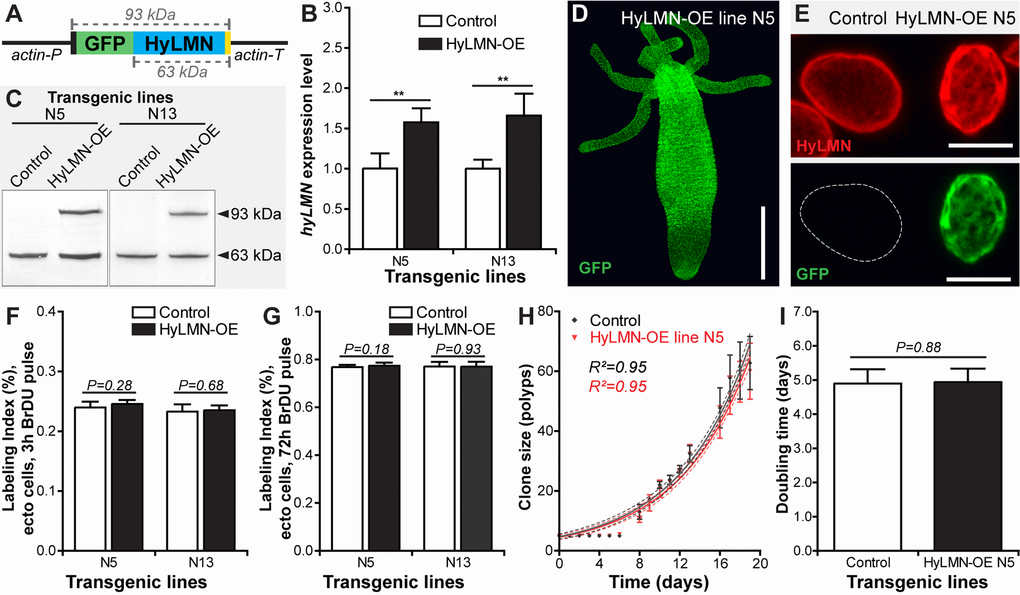
Figure 6.Overexpression of HyLMN does not affect stem cell activity. (A) Genetic construct used for hyLMN overexpression. Actin promotor (actin-P, 1420 bp) drives the expression of the GFP-HyLMN fusion protein (806 a.a., 93 kDa) with an intact C-terminal CaaX box (yellow). Actin terminator (actin-T, 701 bp) flanks the sequence. (B) hyLMN mRNA expression levels in two ectodermal HyLMN-OE lines (N5 and N13) and respective controls, analyzed by qRT-PCR (n=6, mean±S.D.). Asterisks indicate significant changes in expression levels (Mann-Whitney test); P values: N5 line = 0.002, N13 line = 0.002. (C) Western-Blot with anti-HyLMN antibodies confirms expression of the fusion protein GFP-HyLMN (93 kDa) along with the endogeneous HyLMN (63 kDa) in two transgenic lines. In control lines, only endogenous HyLMN is detected. (D) A polyp overexpressing GFP-HyLMN in all ectodermal cells, stained with anti-GFP antibodies. Scale bar: 500 μm.(E) Overexpression of HyLMN results in an uneven distribution of the protein in the nuclear lamina, evidenced by the immunostaining with anti-HyLMN and anti-GFP antibodies. Scale bar: 10 μm.(F) BrdU-labeling index of the ectodermal epithelial cells in HyLMN-OE (N5 and N13 lines) and control polyps after 3 h exposure to BrdU (N5 n=10, N13 n=13, 513.6±51.3 cells per replicate, mean±S.D.). (G) BrdU-labeling index of ectodermal epithelial cells in HyLMN-OE (N5 and N13 lines) and control polyps after 72 h exposure to BrdU (N5 n=15, N13 n=15, 514.9±20.4 cells per replicate, mean±S.D.). (H) Growth curves for the HyLMN-OE line N5 and control polyps (n=4 replicates, each five polyps on day 0; mean±S.D., linear regression lines with 95% CI corridors and goodness of fit R2). (I) Population doubling time (mean±95% CI) for HyLMN-OE line N5 and control polyps derived from the plot on H.