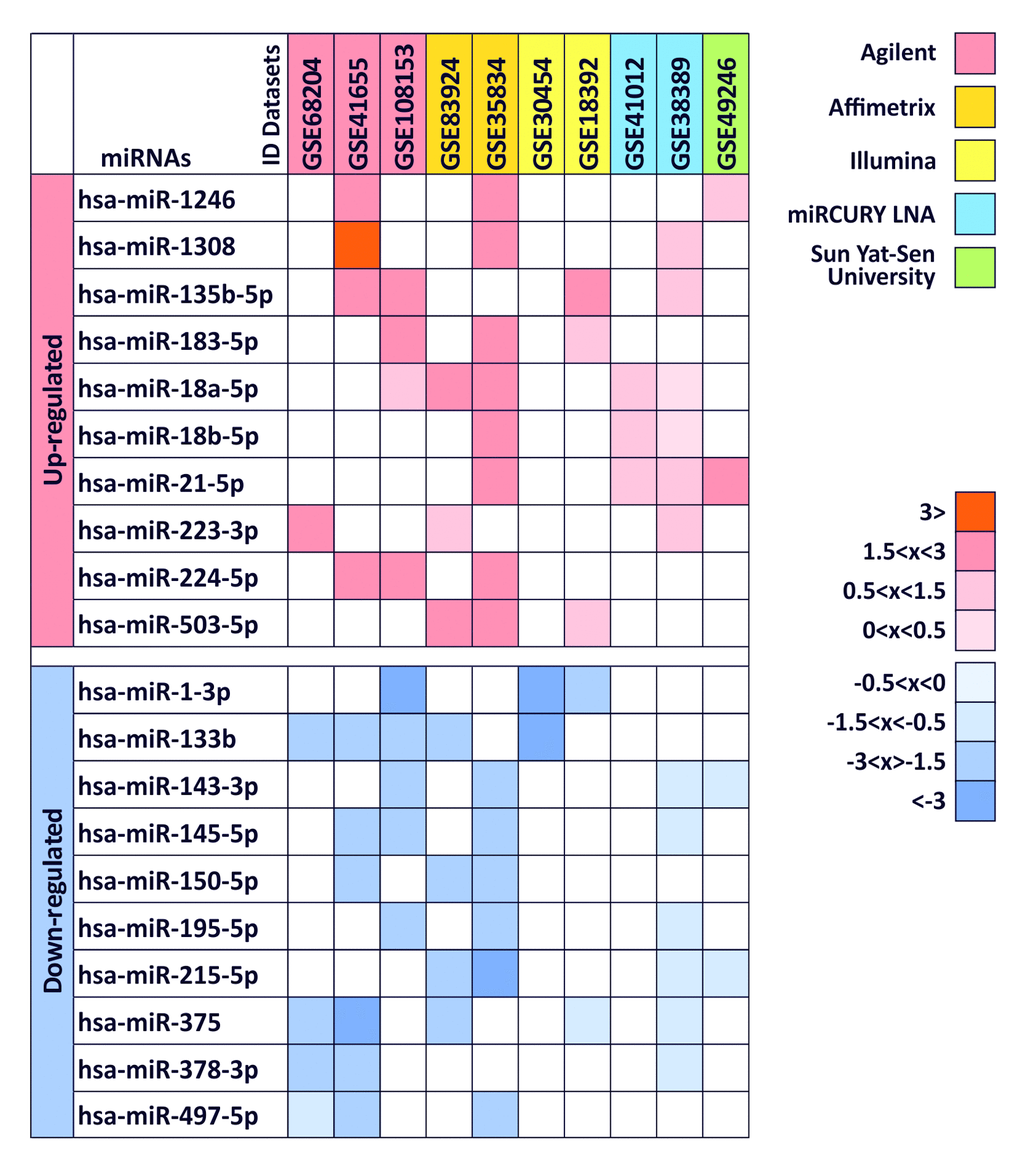
Research Paper Volume 10, Issue 5 pp 1000—1014

Integrated analysis of colorectal cancer microRNA datasets: identification of microRNAs associated with tumor development

class="figure-viewer-img"

Figure 1. Differentially expressed miRNAs between colorectal cancer samples and normal tissues in at least 3 of 10 datasets. logFC values are reported with red scale boxes for up-regulated miRNAs and blue scale boxes for the down-regulated miRNAs. lgFC values were divided in “highly” (logFC ≥ 3), “moderately” (logFC 1.5 <x< 3), “lightly” (logFC 0.5 <x< 1.5) and “poorly” (logFC 0 <x< 0.5) up-regulated or down-regulated (negative logFC values). ID Datasets boxes were colored in a different manner according to the different microarray platform adopted in the dataset.