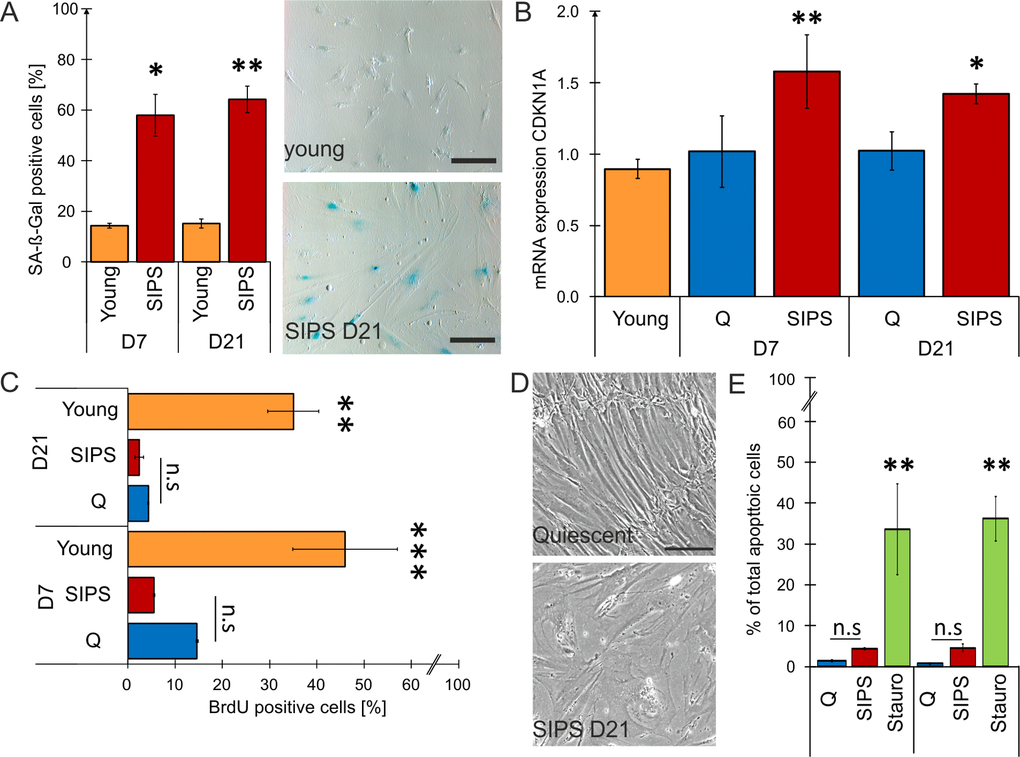
Figure 1.Stress-induced premature senescent (SIPS) fibroblasts mirror hallmarks of cellular senescence. (A) Quantification of SA-ß-Gal staining shows a significant increase of ß-Gal in SIPS HDF compared to young proliferating cells at both time points post stress treatment. Representative pictures show SA-ß-Gal staining of donor HDF161 in SIPS on D21 (bottom) compared to young proliferating control (top - HDF161 in population doublings PD15). 15 pictures were taken randomly at a magnification of 100 X and counting was performed in a blinded fashion. Scale bar = 200 µm. Percentages of SA-ß-Gal positive cells from all pictures were calculated. (B) Expression of CDKN1A confirms senescence of SIPS HDF at both time points. mRNA expression levels of CDKN1A (p21) were detected by qPCR. After normalization to GAPDH, fold changes of SIPS HDF relative to quiescent (Q) control cells from D7 were calculated. (C) SIPS treatment induces permanent cell cycle arrest. Incubation with the nucleoside derivate BrdU for 24 hours followed by FITC immunolabelling for flow cytometry shows no significant incorporation of BrdU into the DNA of Q and SIPS samples compared to young dividing HDF at both time points. (D) SIPS cells show flattened and enlarged morphology. Representative pictures from donor HDF161 Q and SIPS on D21 post H2O2 treatment. Scale bar = 200 µm. (E) Repeated H2O2 treatment does not induce apoptosis. SIPS and Q control cells do not show a substantial increase in percentage (%) of total apoptotic cells at both time points compared to a positive-control (+), treated with 300 nM staurosporin for 24 hours. (A-E) Stress-induced premature senescence (SIPS) of primary human dermal fibroblasts (HDF) derived from three different donors was triggered by chronic H2O2 treatment on nine consecutive days. Hallmarks of cellular senescence were confirmed after seven (D7) and 21 days (D21) post last stress treatment. Averages from three biological triplicates are shown +/- SEM from raw values (n = 3). Statistical analysis was performed using 2-way RM ANOVA tested for condition and day following Bonferroni post test. n.s ≥ 0.05; *p < 0.05; **p < 0.01.