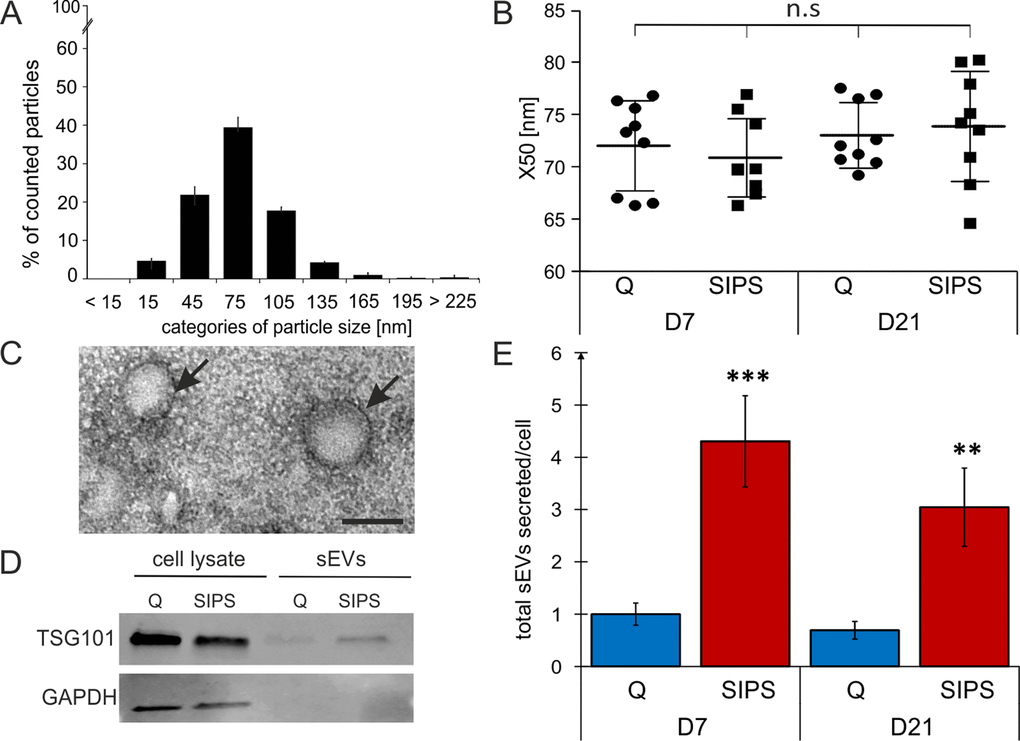
Figure 2.sEVs are members of the senescent-associated secretory phenotype (EV-SASP). (A) NTA reveals a vesicle population below 220 nm. Size distribution of vesicles determined by NTA shows percentage (%) of total counted particles against size presented in categories. (B) Media values (X50) from sEVs range from 65 to 80 nm. X50 values from peak analysis of NTA are indicated +/- SEM. circle: Q, squares: SIPS. Statistical analysis using one-way ANOVA was performed: not significant (n.s) p > 0.05. (C) Representative transmission electron microscopy image of sEVs isolated from HDF. Vesicles are around 100 nm in size and are surrounded by a double lipid membrane (arrows). Scale bar = 100 nm. A representative image of sEVs purified from HDF85 at D7 after the stress treatment is shown. (D) Representative Western blot shows expression of TSG101 (top) and GAPDH (below). Representative Western blot of total cell lysates (left) and sEVs (right lanes) from Q and SIPS HDF of donor HDF85 are shown. Total protein content of total cell lysates and purified sEV was analyzed by BCA assay and equal amounts of protein were loaded onto the gel (20 µg). (E) Senescent cells secrete more sEVs per cell than quiescent controls. Total concentration of tracked particles was normalized to the total cell number used for secretion into conditioned media. Fold changes of total particles secreted per cell, relative to Q control cells from D7, +/- relative SEM, are shown. Statistical analysis was performed using 2-way RM ANOVA tested for condition (p < 0.0001) and day (p = 0.28) following Bonferroni post test. **p < 0.01; ***p < 0.01. (A-B and E) Averages from three biological triplicates (n = 3) and two different time points each SIPS and Q, were measured in technical triplicates (n = 18) +/- relative SEM.