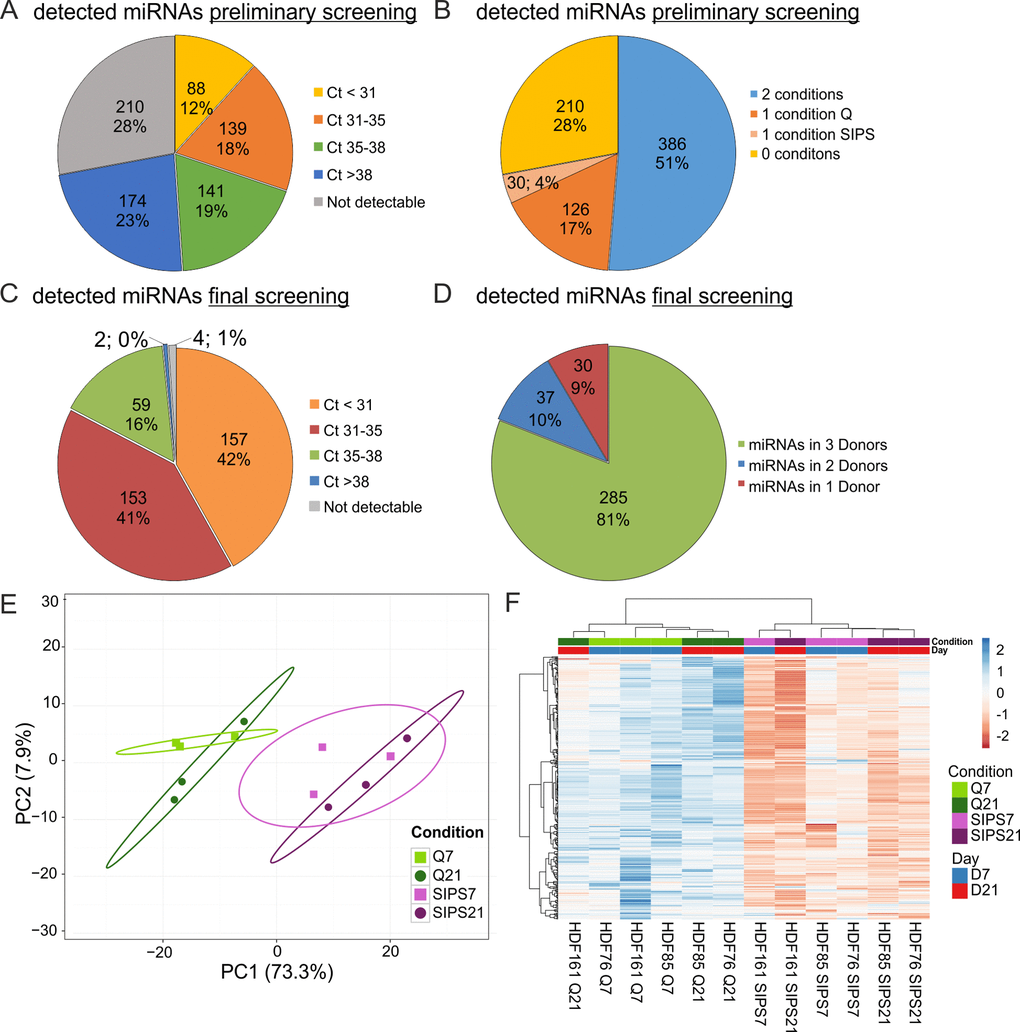
Figure 3.sEV-miRNAs as part of the SASP were identified in a preliminary and final qPCR screening. (A) miRNA profiling of the preliminary screening detects in total 542 (72%) secreted miRNAs. Categorization of Ct-values shows 368 miRNAs with an average signal < 38 in one or both conditions (Q, SIPS) tested. (B) The preliminary screening detects in total 386 miRNAs in both conditions tested. (C) The final qPCR screening detects 369 miRNAs with Ct-values below 38. 375 miRNAs were tested in all conditions and time points. % and number of total miRNAs detected in the screening experiment are shown. Categorization according to Ct-values. MiRNAs with an average Ct-value < 31, between 31 and 35, between 35 and 38, > 38 and not detectable are displayed. (D) The final qPCR screening detects 81% of all screened miRNAs in three donors. Averages from D7 and D21 are presented. 81% (285) of miRNAs were detected in all three donors SIPS and Q. 10% (37) of miRNAs were detected in at least two donors and 9% (30) of miRNAs were detected in one donor. (E) Principal Component analysis of sEV-miRNAs from SIPS and Q control cells from day 7 (D7) and day 21 (D21) after the treatment. The expression matrix shows the clustering of 12 samples and 369 miRNAs. Ellipses indicate a confidence level of 95% that a new observation will fall into it. Illustrated 2D-biplot explains a variance of 73.3% in principal component 1 and 7.9% in principal component 2, respectively. Exploratory analysis was done with ClustVis. Green: Q; Purple: SIPS; light colors and rectangular D7; dark colors and circle D21. (F) sEV-miRNAs are higher secreted from SIPS cells compared to Q controls. Heatmap and hierarchical clustering of 369 sEV-miRNAs after D7 and D21 (n = 12). Unit variance scaling was applied and rows are centered. MiRNAs were clustered according to correlation distance and Ward linkage method. Samples in columns are clustered using Euclidean distance and Ward linkage method. Green: Q; Purple: SIPS; light colors and blue D7; dark colors and red D21. Colors in matrix: red = upregulated, blue = downregulated. (A-B) Magnitude of secreted sEV-miRNAs was assessed in a preliminary screening using Q control and SIPS HDF of one cell strain (HDF76) and from one time point (D21). 752 miRNAs were screened using the qPCR ready to use panels supplied by Exiqon. (C-F) Final screening was performed with customized qPCR panels using three different HDF cell strains (n = 3) each Q and SIPS from two different time points (D7 and D21).