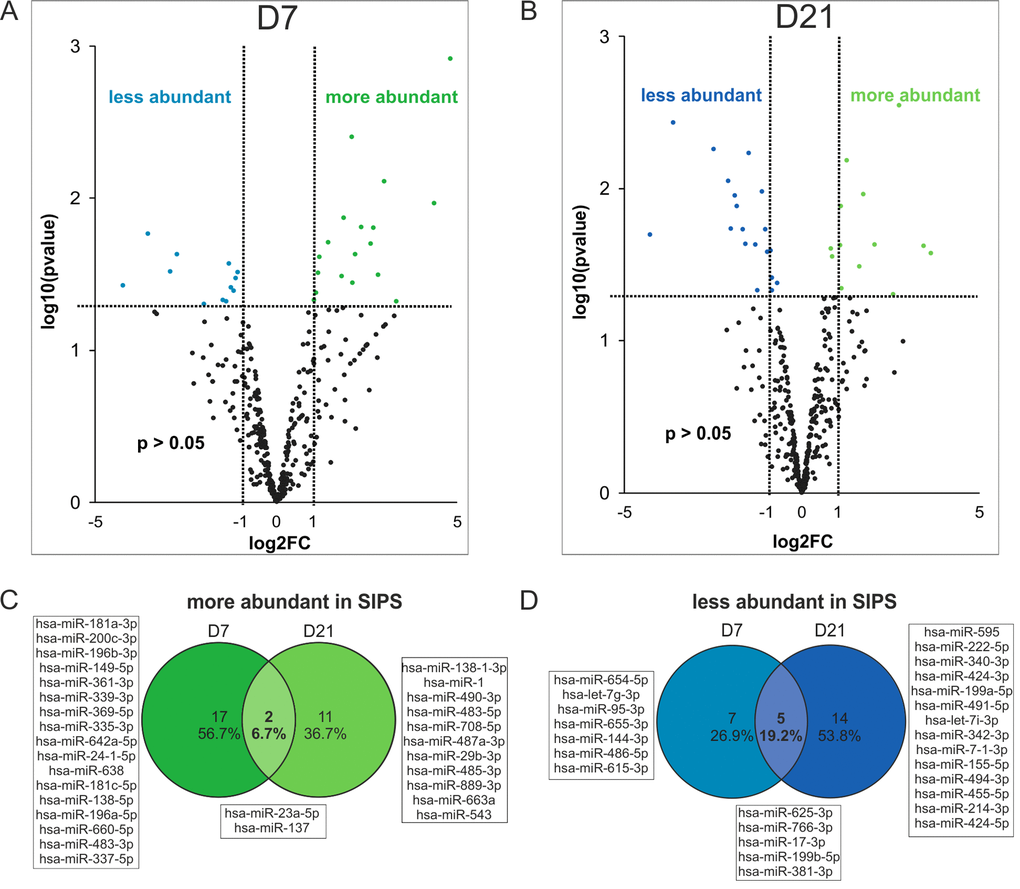
Figure 5.Changes in miRNA composition of senescent cell derived sEVs. (A) Volcano plot shows 31 significantly differently present senescence-associated (SA) sEV-miRNAs after normalization to the global means at D7 and (B) 32 SA sEV-miRNAs at D21 after the last H2O2 treatment. (C) Venn diagram shows miRNAs more abundantly present in sEVs of SIPS cells. (D) Venn diagram shows miRNAs less abundant in sEVs of SIPS cells. (A-B) Raw Ct-values from each sample were normalized to the respective global mean. Log2FC of SIPS relative to Q control cells were calculated. Values from D7 (panel A) and D21 (panel B) recovery are plotted on x-axis against their individual -log10(p-value) on y-axis. Horizontal dotted lines indicate a separation between miRNAs passing a p-value higher or lower than 0.05. Vertical dotted lines separate secreted miRNAs with log2FC > 1 or log2FC < 1. MiRNAs reaching a p-value < 0.05 are illustrated with green and blue dots and miRNAs with a p-value > 0.05 are shown in black. None reached the 0.05 cut-off value for the FDR of an adjusted p-values. Analysis was performed using three different HDF cell strains (n = 3) each Q and SIPS from two different time points (D7 and D21). (C-D) Log2FC was calculated and significantly regulated (p-value < 0.05) miRNAs from D7 and D21 were compared in a Venn diagram.