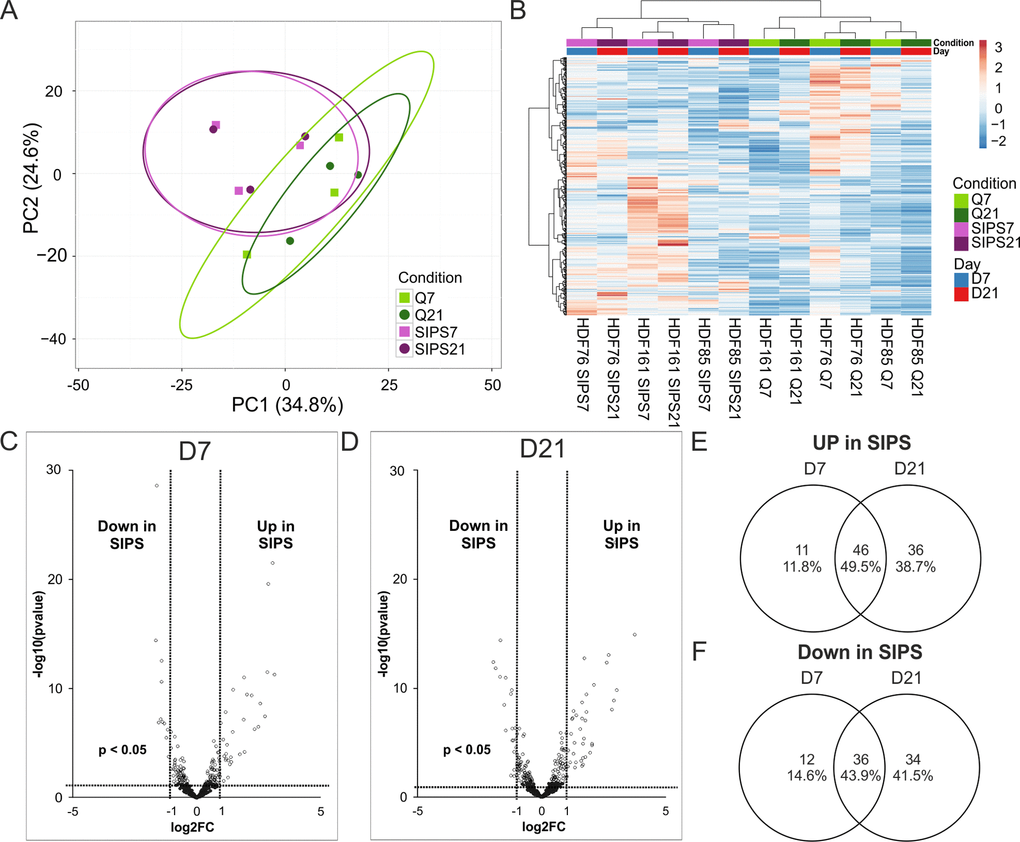
Figure 6.Intracellular miRNA analysis by NGS identifies early and deep senescence specific miRNAs. (A) Principal component analysis of SIPS versus Q HDF. Principal components were calculated using singular value decomposition (SVD) for imputation. Rows were scaled by applying unit variance scaling. Confidence level of 95% is indicated by ellipses assuming that a new observation from the same group will fall into it. Expression matrix of principal component 1 shows a variance of 34.8% and 24.6% in principal component 2. (B) Heatmap and hierarchical clustering of samples and miRNAs of SIPS versus Q human dermal fibroblasts. Clustering was done according to Euclidian distance and Ward linkage method. Samples in columns were clustered using correlation distance and Ward linkage method. (colors in matrix: red = highly transcribed = upregulated, blue = low transcribed = downregulated). (C) Volcano plot of differentially transcribed miRNAs in SIPS cells after seven (left D7) and (D) 21 days (right D21) post stress treatment. Log2FC are plotted on x-axis against their individual -log10 (p-value) on y-axis. Horizontal dotted lines indicate a separation between miRNA differences of a p-value higher or lower than 0.05. Vertical dotted lines separate transcribed miRNAs with log2FC > 1 or log2FC < 1. MiRNAs reaching a p-value < 0.05 are illustrated with white dots and miRNAs with a p-value > 0.05 are shown in black. (E) Venn diagram shows upregulated miRNAs of senescent cells on D7 and on D21. 46 miRNAs are commonly upregulated at both time points of senescence. (F) Venn diagram shows downregulated miRNAs of senescent cells on D7 and on D21. 36 miRNAs are commonly downregulated at both time points of senescence. (A-D) Analysis was performed using three different HDF cell strains (n = 3) each Q and SIPS from two different time points (D7 and D21). Differential expression analysis and statistics, calculated with Edge, was done with 432 miRNAs with normalized TPM signals > 5 in all conditions in at least 1 donor. (A-B) Each color and symbol represents another annotation defined by data input file. Green: Q; Purple: SIPS; light colors and rectangular D7; dark colors and circle D21.