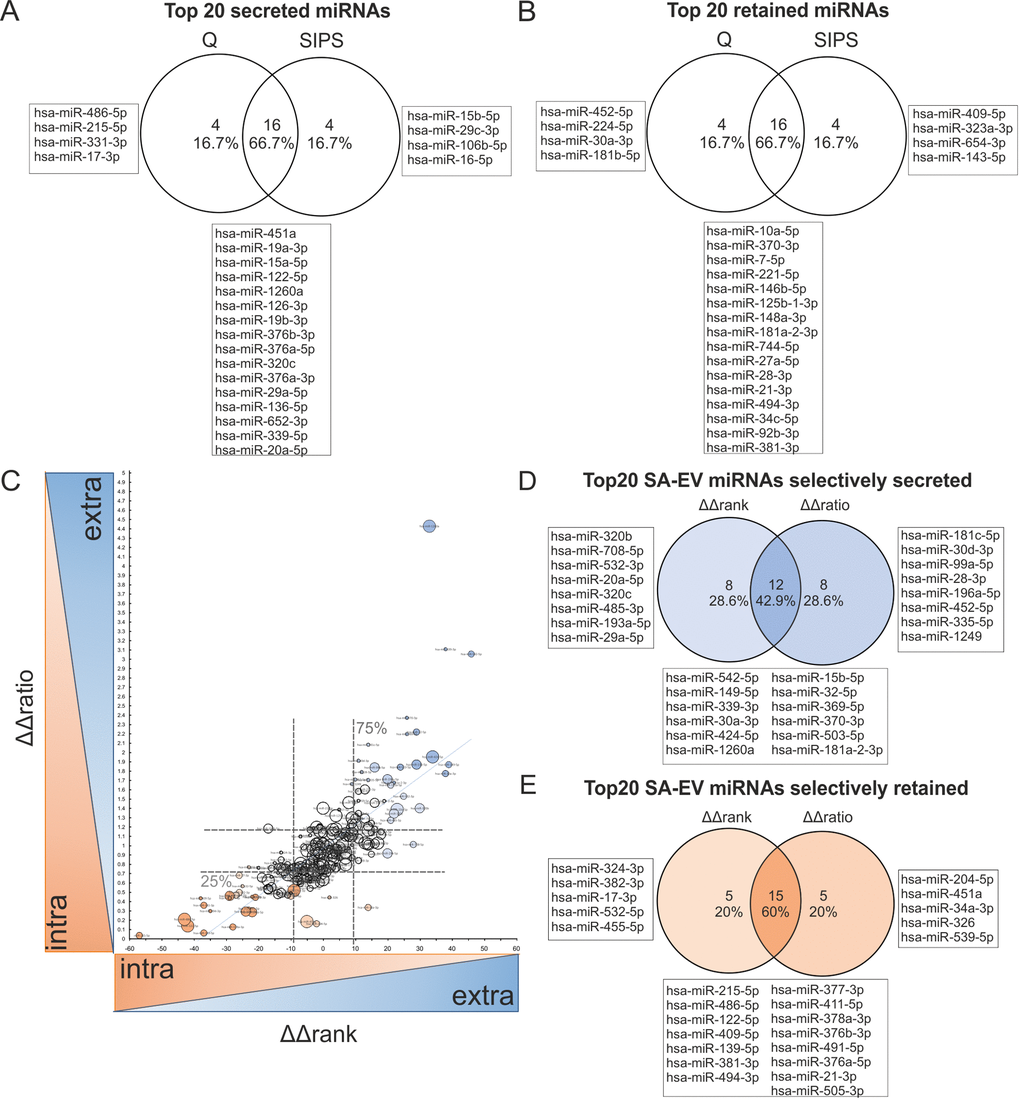
Figure 7.Correlation of intracellular and sEV-miRNAs identifies specifically secreted versus retained miRNAs in cellular senescence. (A) Venn diagram of top 20 secreted miRNAs (positive values) from HDF, calculated by Δrank = rankintra – rankextra from Q and SIPS separately. (B) Venn diagram of top 20 retained (negative values) miRNAs in HDF, calculated by Δrank = rankintra – rankextra from Q and SIPS separately. (C) Selectively senescence-associated secreted (high values) or retained (low values) miRNAs are identified. ΔΔrank and ΔΔratio were correlated and specifically secreted (high values of ΔΔrank and ΔΔratio) or retained (low values of ΔΔrank and ΔΔratio) senescence-associated miRNAs were identified. Spearman correlation R = 0.81 with a 95% confidence interval 0.76 to 0.85 P value (two-tailed) < 0.0001. Bubble size corresponds to quartiles calculated from transformed average Ct-values, whereby the larger the bubble size, the higher the expression value. Dotted lines represent the 25% and 75% percentiles, which define the specifically secreted and retained miRNAs in senescence. ΔΔrank: 25%: 8.0; Median: -0.5; 75%: 9.0; ΔΔratio: 25%: 0.7099; Median: 0.927; 75%: 1.186. (D) Venn diagram of the top 20 specifically secreted senescence-associated sEV-miRNAs. MiRNAs are identified by comparing the top 20 of ΔΔrank and ΔΔratio method. (E) Venn diagram of top 20 specifically retained senescence-associated miRNAs. MiRNAs are identified by comparing the top 20 of ΔΔrank and ΔΔratio method. (F) (A-E) Correlation was performed with 228 miRNAs identified intracellularly (small RNA-NGS) as well as in sEVs (qPCR panels) in samples derived from three different HDF cell strains (n = 3) each Q and SIPS from two different time points (D7 and D21).