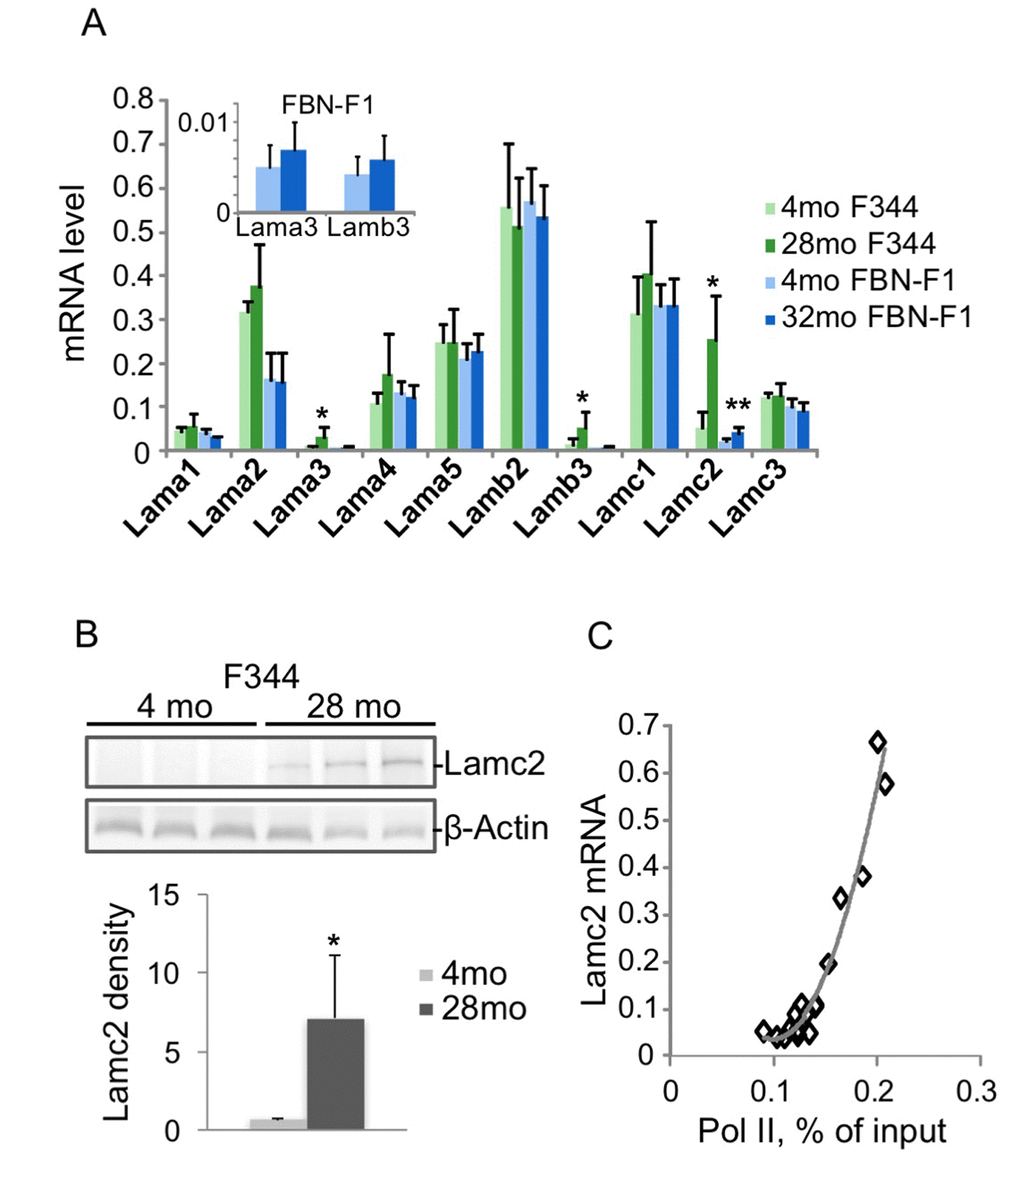
Figure 1.Changes in laminin gene expression associated with aging in rat kidneys. RNA was extracted from kidney fragments of 4 and 28 months old (mo) F344, and 4 and 32 mo FBN-F1 animals. Equal amounts of each RNA preparation were reverse transcribed and analyzed by qPCR with primers to laminin genes. Transcript levels were normalized to Gapdh mRNA. (A) Laminin mRNA levels were averaged per age group. Bars represent mean +SD, n=6 per age group. Inset, Lama3 and b3 mRNA levels in FBN-F1 animals shown at different scale. *p<0.05, **p<0.005. (B) Western blot analysis of Lamc2 levels in kidney extracts. β-Actin antibodies were used as a control. Densitometry analysis of blots is shown in the graph below as Lamc2/β-actin band ratio, mean +SD. (C) Pol II levels at Lamc2 gene were examined by ChIP assay with primers to the promoter of Lamc2 gene (-200 bp). Pol II density, expressed as a percent of input, is plotted against Lamc2 mRNA level. All age groups are shown.