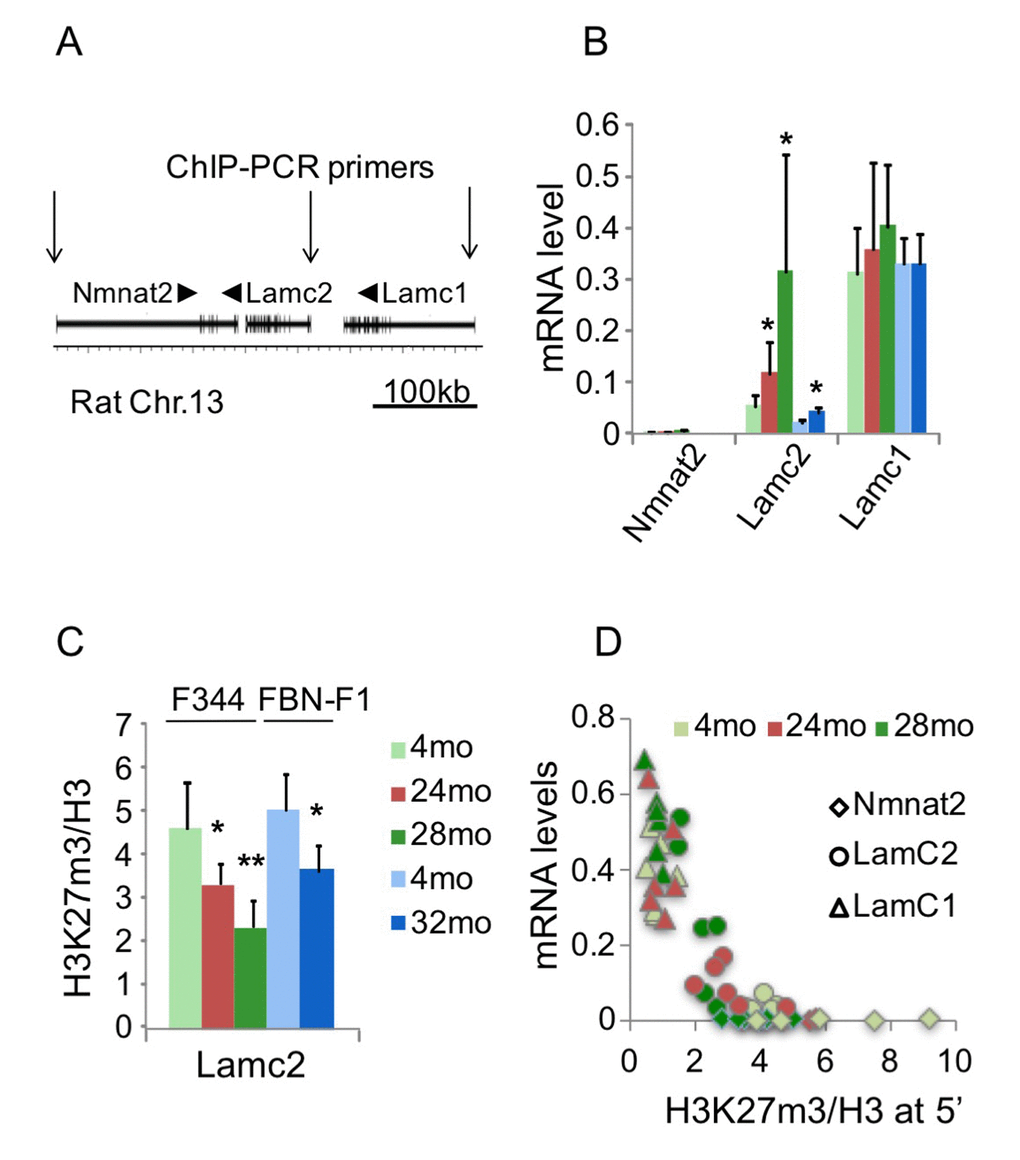
Figure 2.Changes in transcription and H3K27m3 levels at the Lamc1-Lamc2 genomic region. (A) A cartoon showing Nmnt2-Lamc2-Lamc1 genomic region. Arrows indicate position of 5’ PCR primer pairs used in ChIP assay. (B) Nmnat2, Lamc2 and Lamc1 transcript levels in 4, 24, 28 mo F344 and 4, 32 mo FBN-F1 kidneys. (C) ChIP analysis of H3K27m3 levels normalized to H3 at Lamc2 promoter in F344 and FBN-F1 young and old kidneys. Shown are mean values +SD, n=6 per age group, *p<0.05, **p<0.005. (D) H3K27m3 levels at the promoters of Nmnat2, Lamc2, and Lamc1 genes are inversely correlated with corresponding transcript levels. ChIP and RT PCR analyses were done in F344 kidney fragments. H3K27m3 data were normalized to H3 levels, and mRNA levels measured by RT PCR were normalized to Gapdh transcript levels. Each data point represents an individual animal. All age groups are shown.