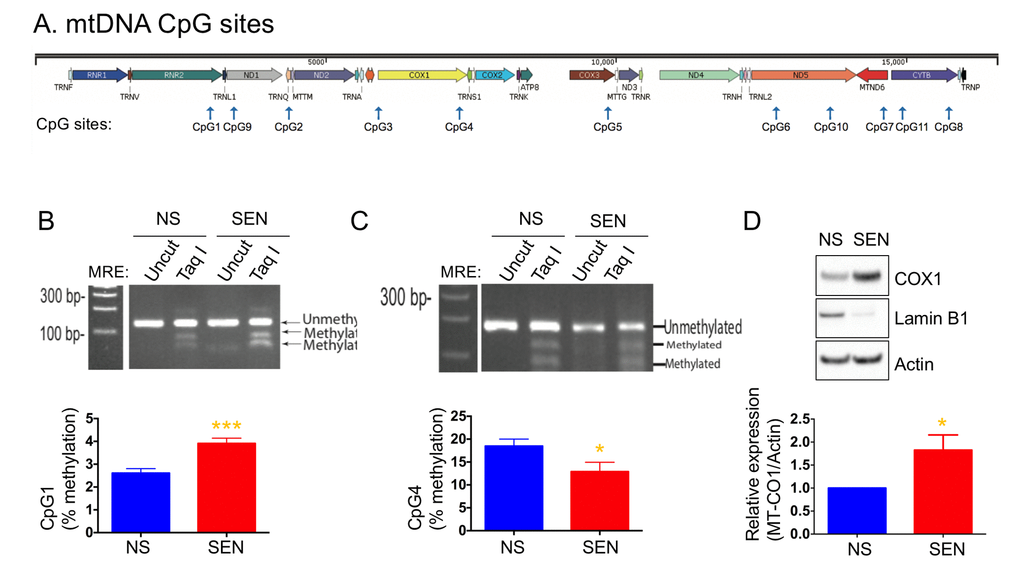
Figure 4.Mitochondria DNA methylation changes during doxorubicin-induced senescence. (A) Schematic diagram of mitochondrial genes and CpG sites in the mtDNA. Quantification and representative agarose gel images of mtDNA methylation levels at the site of (B) CpG1 and (C) CpG4. (D) Quantification and representative western blots of COX1 (MT-CO1) in non-senescent and senescent cells. Reduced lamin B1 was used as a senescence marker. Data are reported as mean ± SEM of three to four independent experiments. Significant differences were determined by Student’s t-tests. *p<0.05, ***p<0.001. Abbreviations: NS, Non-senescent cells (quiescent); SEN, Senescent cells.