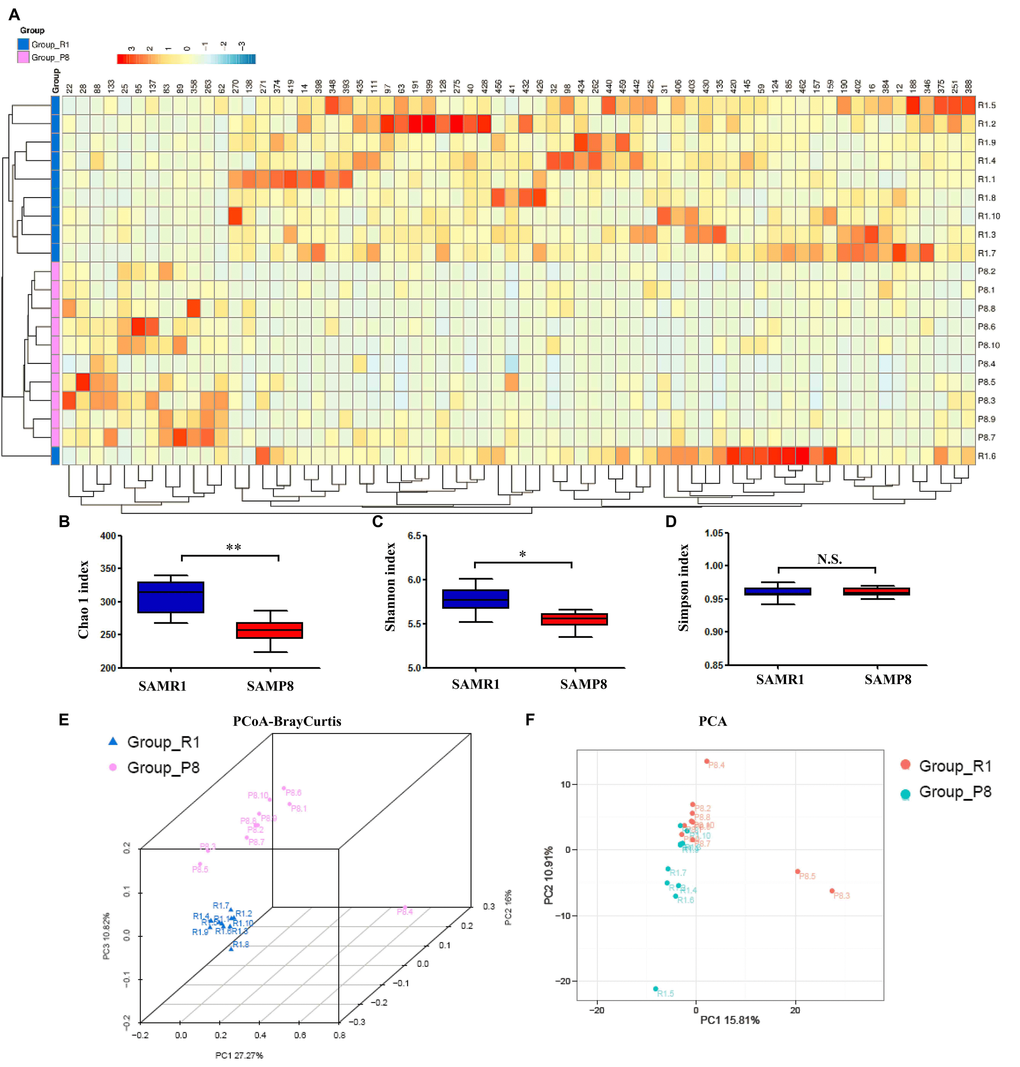
Figure 2.Differential profiles of the gut microbiota between SAMR1 and SAMP8 mice. (A) Heat map of differential levels of bacteria between the groups. (B) Chao 1 index (t-test, P < 0.01). (C) Shannon index (t-test, P < 0.05). (D) Simpson index (t-test, P > 0.05). (E) PCoA analysis of gut bacteria data (Bray–Curtis dissimilarity). (F) PCA analysis of gut bacteria data. α-diversity data are shown as mean ± SEM (n = 10). PCA: principal component analysis; PCoA: principal coordinates analysis. *P < 0.05, **P < 0.01.