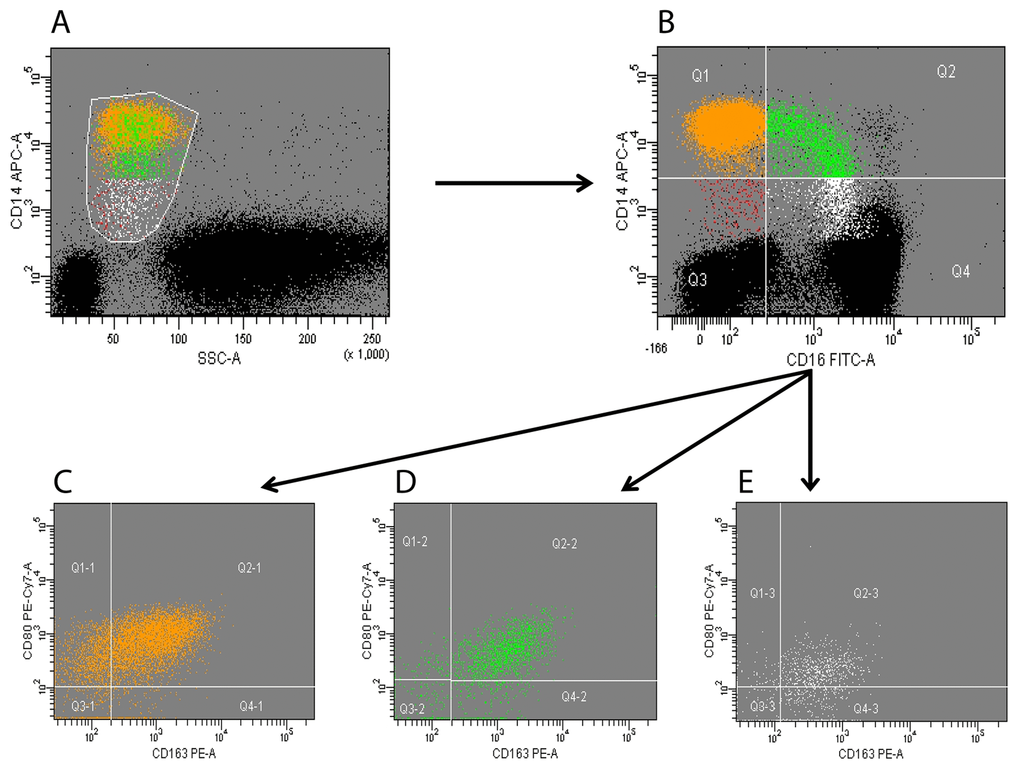
Figure 1.Flow cytometry analysis of circulating monocytes. Peripheral blood mononuclear cells (PBMCs) were collected and analyzed; monocytes were identified according to side scatter and CD14 profile (panel A). CD14+ cells (total monocytes) were subsequently separated according to CD16 expression into classical (orange), intermediate (green) and non-classical (white) subsets (panel B). Expression of CD80 and CD163 was analyzed on each of the three subsets (panels C-E). Black dots in panels A-B represent CD14-negative PBMCs (i.e. lymphocytes and granulocytes). A minimum of 200,000 PBMCs were acquired for each sample. The figure is representative of a single experiment.