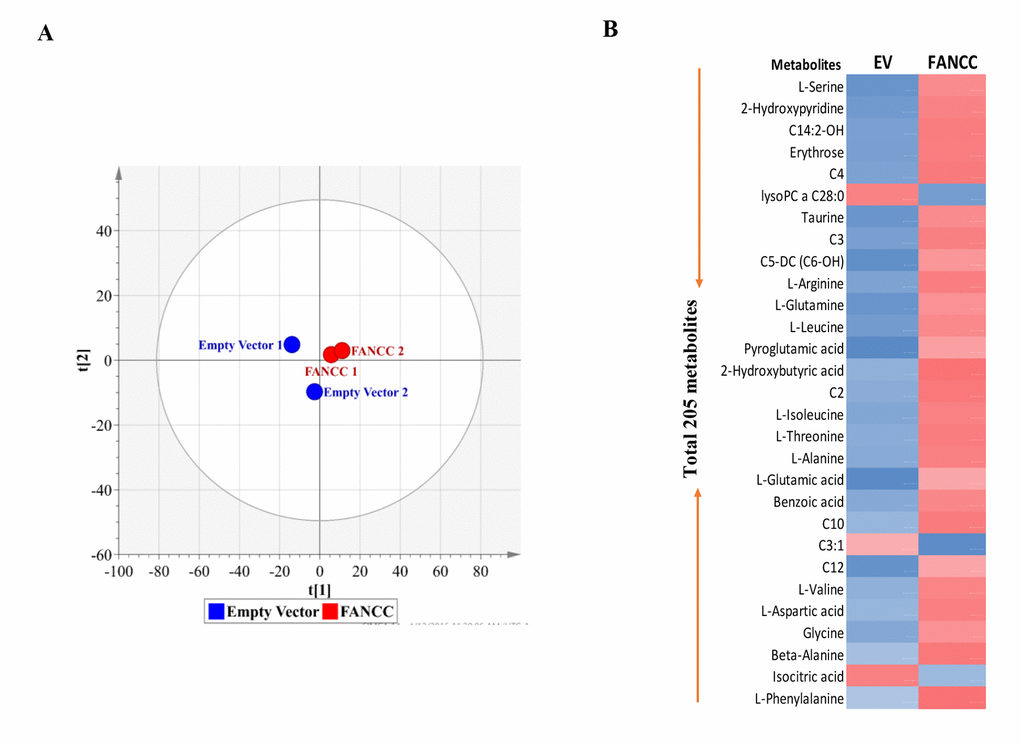
Figure 2.Metabolically profiling of FANCC-high or low cells. (A)OPLS-DA score plots of metabolic profiles were derived from the data of GC-TOMS, which were generated from FANCC-high or low cells. (B)The heat-map for the intensity variations of the total metabolites identified with GC-TOFMS and UPLC-MS/MS. Blue or red color indicates reduced or elevated levels of the metabolites respectively in FANCC-high cells compared to FANCC-low cells.