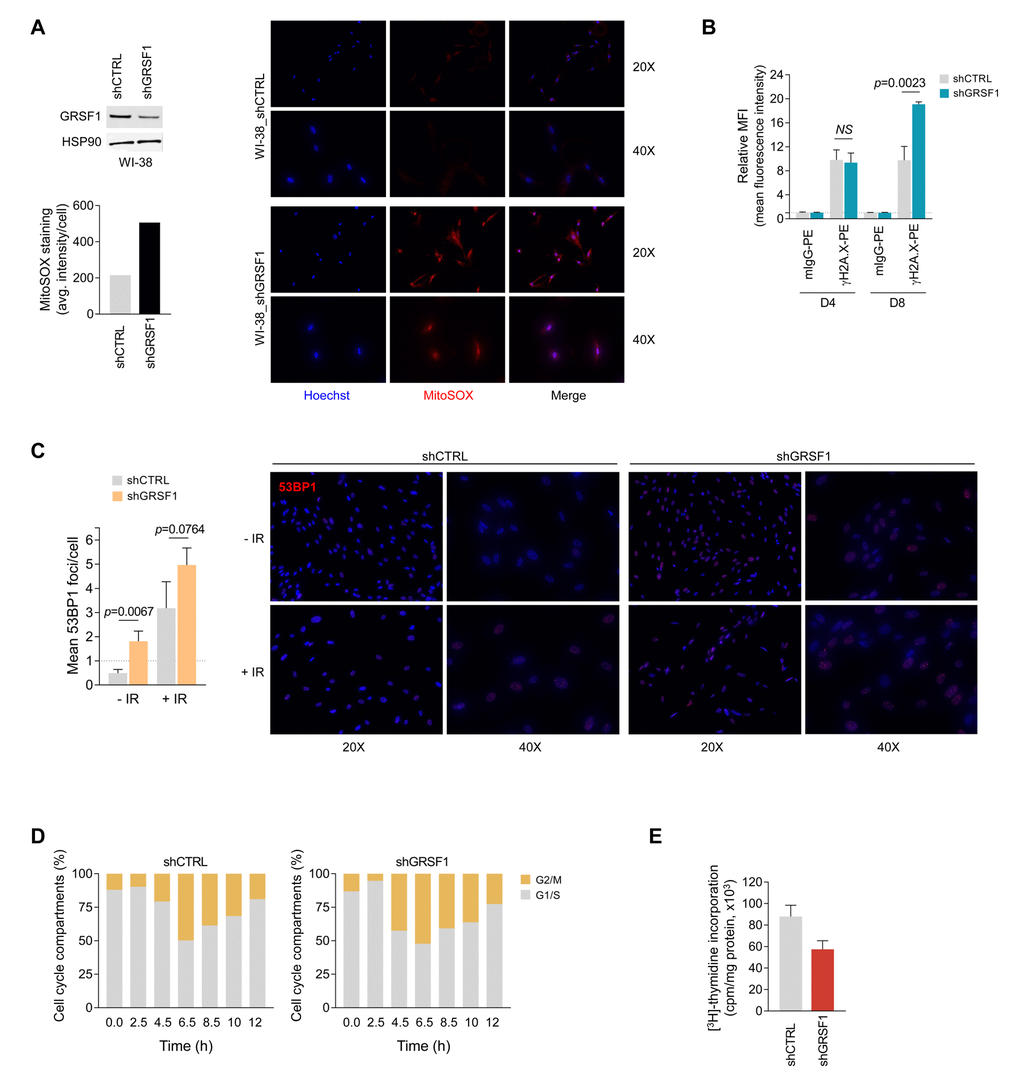
Figure 3.GRSF1 knockout or silencing elevates DNA damage, reduces DNA replication, and delays cell cycle progression. (A) Mitochondrial superoxide was assessed by fluorescent microscopy in shRNA-transfected WI-38 fibroblasts expressing normal (shCTRL) or reduced (shGRSF1) levels of GRSF1. The mitochondrial superoxide probe MitoSOX Red was employed to measure the relative production of superoxide, which was quantified as the average (avg.) fluorescence intensity (left); representative fluorescence images of the oxidized MitoSOX fluorescence signal (red) are shown (right). GRSF1 levels in infected WI-38 cells were assessed by Western blot analysis (left). (B) DNA double-strand breaks (DSBs) were monitored by measuring the phosphorylated histone H2A.X on serine 139 (γH2A.X) by using flow cytometry-based analysis at 4 and 8 days (D4 and D8) after IR (10 Gy). (C) WI-38 fibroblasts were infected with lentiviruses expressing shGRSF1 or shGRSF1; following ionizing irradiation (10 Gy) DNA damage was assessed by immunofluorescence to visualize 53BP1 foci (right); foci were counted in WI-38 fibroblasts expressing shCTRL or shGRSF1 that had been left untreated (-IR) or had been exposed to IR (+IR) (Left). (D) WI-38 fibroblasts that expressed constitutively shGRSF1 or shCTRL were synchronized at G1/S phase by double-thymidine block, released, and collected for analysis of cell cycle progression at the indicated time points by flow cytometry; the progression of cells through the division cycle was quantified (G2/M, G1/S). (E) WI-38 fibroblasts were infected with shGRSF1 or shCTRL lentiviruses and expanded for three weeks; the incorporation of [3H]-thymidine was then quantified as a measure of cell proliferation. Data in (B,C,E) represent the means and S.D. from three independent experiments.