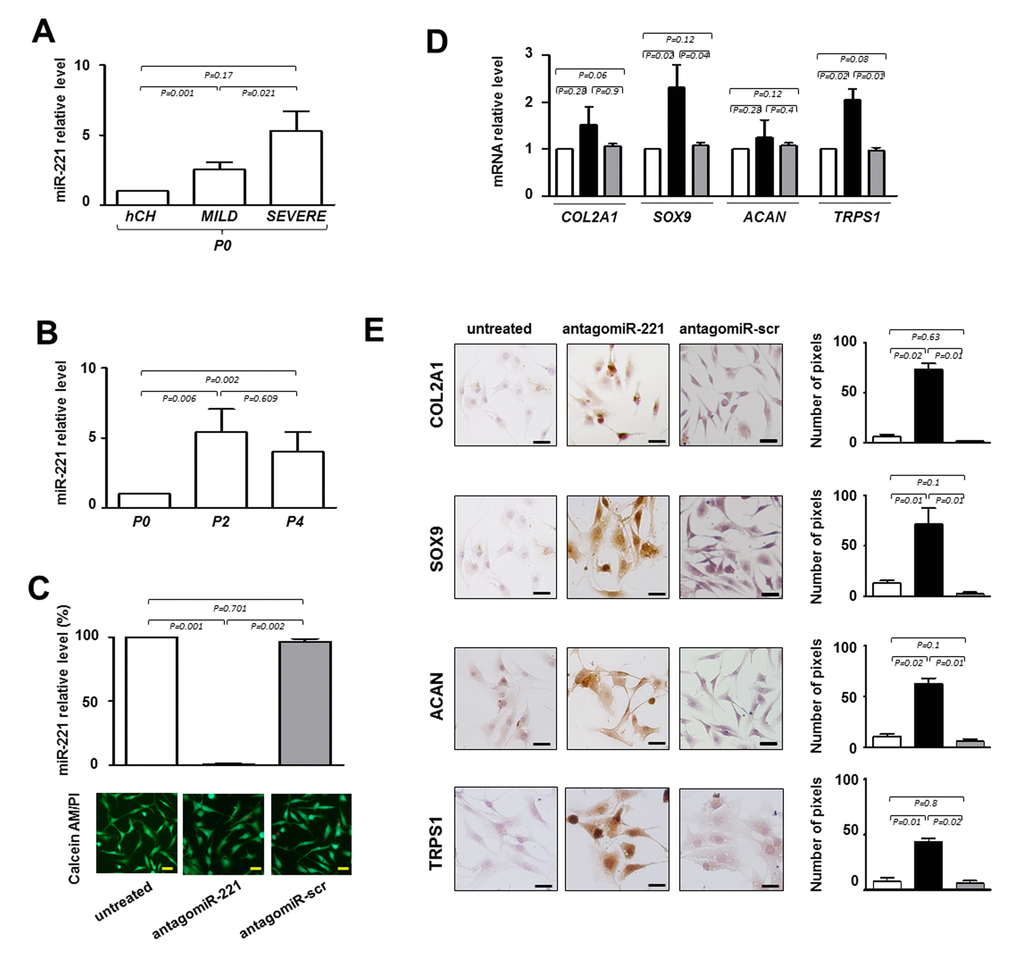
Figure 2.Evaluation of the effect of antagomiR-221 treatment on intervertebral disc cells (IVD) cells. (A) Before transfection the expression levels of miR-221 were measured in P0 cells from MILD and SEVERE IDD by qRT-PCR. Data are presented as fold changes relative to control represented by human freshly isolated chondrocytes (hCH). Results represent mean ± SD (hCH group, n = 6; MILD group, n = 7; SEVERE group, n = 9). Exact P-values are reported. (B) miR-221 levels were measured during de-differentiation process from passage 0 (P0) to passage (P4). Data are presented as fold changes relative to P0 cells. (P0 group, n = 6; P2 group, n = 6; P4 group, n = 6). Exact P-values are reported. Monolayered P2 cells were then transfected with antagomiR-221 (black column), a scrambled oligonucleotide (antagomiR-scr) (gray column) or remained untreated (white column) (C, D, E). (C) The efficiency of miR-221 knockdown was determined by qRT-PCR (C) and data are presented as fold change respect to control untreated cells ±SD (n = 10). Exact P-values are reported. Cell viability of transfected cells was determined by double staining with Calcein-AM/propidium iodide. The green fluorescence indicates the presence of calcein-labeled live cells, while propidium iodide-labeled dead cells are revealed by red fluorescence. Merged photomicrographs are reported. Scale bars: 20 μm. Expression of COL2A1, SOX9, ACAN and TRPS1 chondrogenic markers was assessed by qRT-PCR D) and immunocytochemistry E). (D) The expression of typical chondrogenic markers evaluated at mRNA level. mRNA data are presented as fold change relative to untreated cells. Results represent means ± SD (n = 10). Exact P-values are reported. (E) The expression of typical chondrogenic markers evaluated at protein level. Representative optical photomicrographs of COL2A1, SOX9, ACAN and TRPS1 immunostaining are reported. Protein levels were quantified by densitometric analysis of immunocytochemical pictures using ImageJ software and expressed as means of pixels per one hundred cells ±SD (n = 10). Exact P-values are reported. Scale bars: 20 μm.