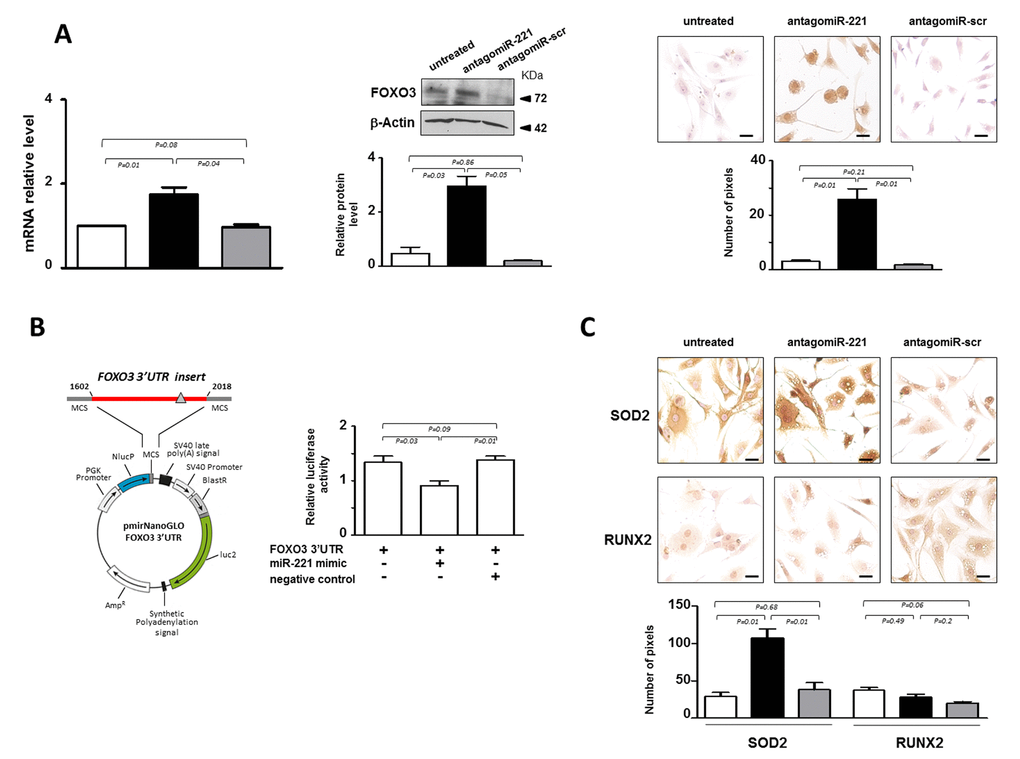
Figure 3.miR-221 targets FOXO3 in IVD cells. (A) Evaluation of the effect of antagomiR-221 treatment on FOXO3 expression. The expression levels of FOXO3 were assessed in antagomiR-221 treated de-differentiated P2 cells by qRT-PCR, Western blot and immunocytochemistry. mRNA data are presented as fold change relative to untreated cells. Results represent mean ± SD (n = 10). Exact P-values are reported. Representative Western blot of FOXO3 protein analysis is reported. Bar graphs show the densitometric analysis of all samples analyzed; β-Actin was used as loading control, data were expressed as ratio of FOXO3 in respect to β-Actin and presented as mean ± SD (n = 5). Representative optical photomicrographs of FOXO3 protein expression and localization assessed by immunocytochemistry are reported. Protein levels were quantified by densitometric analysis of immunocytochemical pictures using ImageJ software and expressed as means of pixels per one hundred cells ±SD (n = 10). Exact P-values are reported. Scale bars: 20 μm. In the graphs: antagomiR-221 (black column), scrambled oligonucleotide (antagomiR-scr) (gray column) treated or untreated (white column) cells are reported. (B) Validation of miR-221 target site in the FOXO3 3’-UTR by reporter gene assay in IVD cells. A luciferase reporter vector containing partial sequence (+1602/+2018) of the FOXO3 3’-UTR harboring the predicted miR-221 target site (gray triangle), in the 3’ UTR of a Nano Luc luciferase gene was used. P2 cells were transfected for 48 hours with a combination of reporter constructs (100 ng) along with miR-221 mimic or Negative control (30 nM). Afterwards, Nano Luc luciferase reporter gene (NlucP) and Firefly luciferase control reporter activities (luc2) were measured using a Nano-Glo Dual-Luciferase assay and represented as mean ±SD (n = 5). Exact P-values are reported. (C) The expression of SOD2 and RUNX2 was assessed by immunocytochemistry. Representative optical photomicrographs are reported. Protein levels were quantified by densitometric analysis of immunocytochemical pictures using ImageJ software and expressed as means of pixels per one hundred cells ±SD (n = 10). Exact P-values are reported. Scale bars: 20 μm. In the graphs, antagomiR-221 (black column), scrambled oligonucleotide (antagomiR-scr) (gray column) treated or untreated (white column) cells are reported.