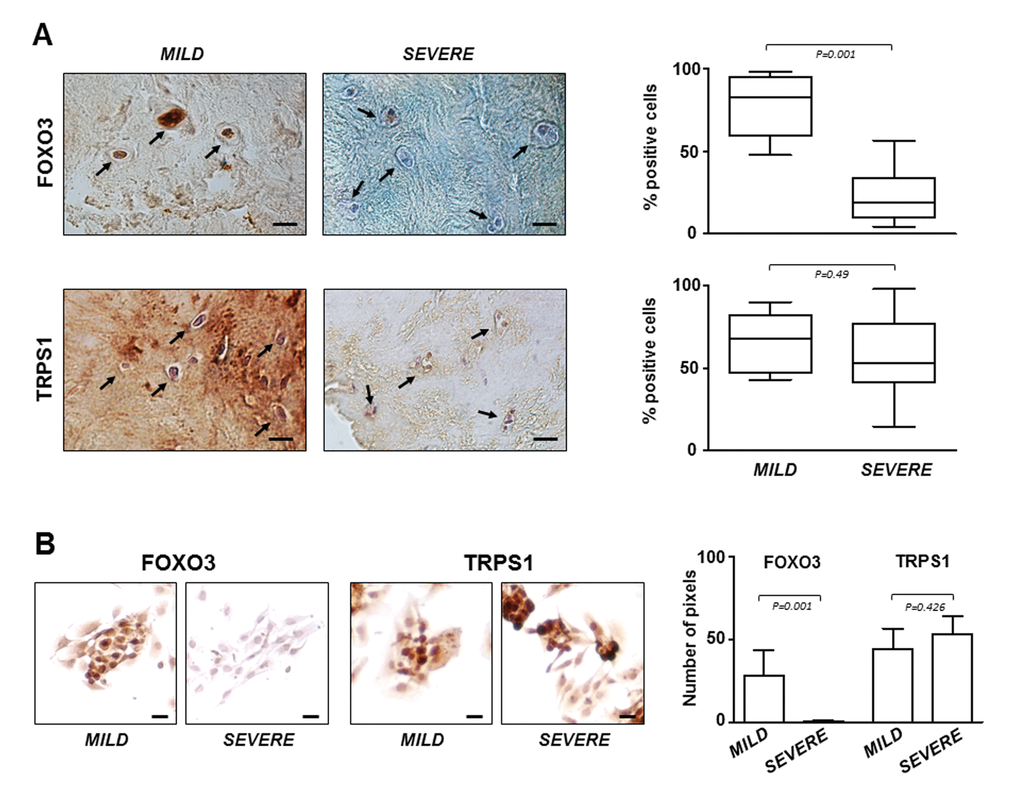
Figure 4.FOXO3 and TRPS1 expression in IVD tissues and P0 cells. (A) Immunohistochemistry on IVD tissues with MILD or SEVERE IDD and (B) immunocytochemistry on P0 cells demonstrating the presence of FOXO3 and TRPS1 (positive cells in representative optical photomicrographs are indicated with arrows). Protein levels were quantified by densitometric analysis of immunostaining using ImageJ software and expressed as % of positive cells per area (5 sections per sample; MILD group, n = 7; SEVERE group, n = 9). The results are reported as Whisker box plot representing min to max (line indicates median). For densitometric quantification of immunocytochemical pictures data were expressed as means of pixels per one hundred cells ±SD (MILD group, n = 7; SEVERE group, n = 9). Exact P-values are reported. Scale bars: 20 μm.