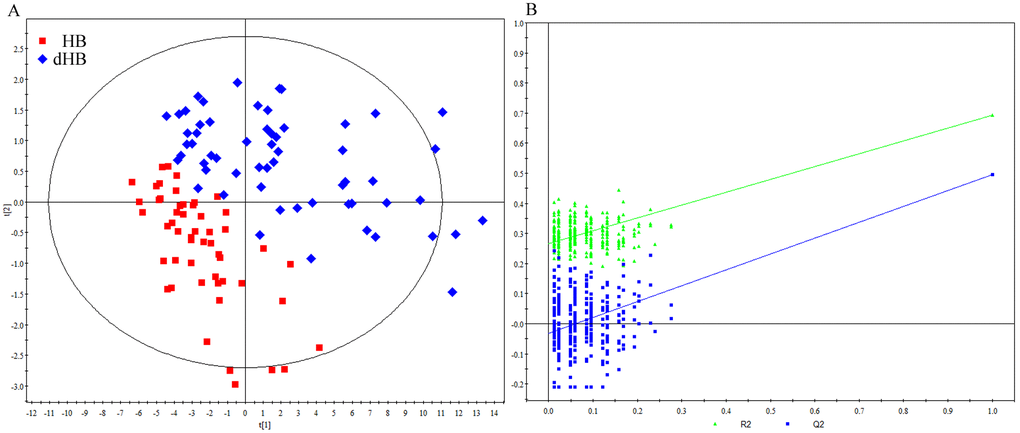
Figure 2.Metabonomic analysis of urine samples from HB and dHB. (A) OPLS-DA score plots showing an obvious separation between dHB (blue diamond) and HB (red square) in the training set; (B) 300-iteration permutation test showing the corresponding permuted values (bottom left) as significantly lower than original R2 and Q2 values (top right), demonstrating the OPLS-DA model's robustness.