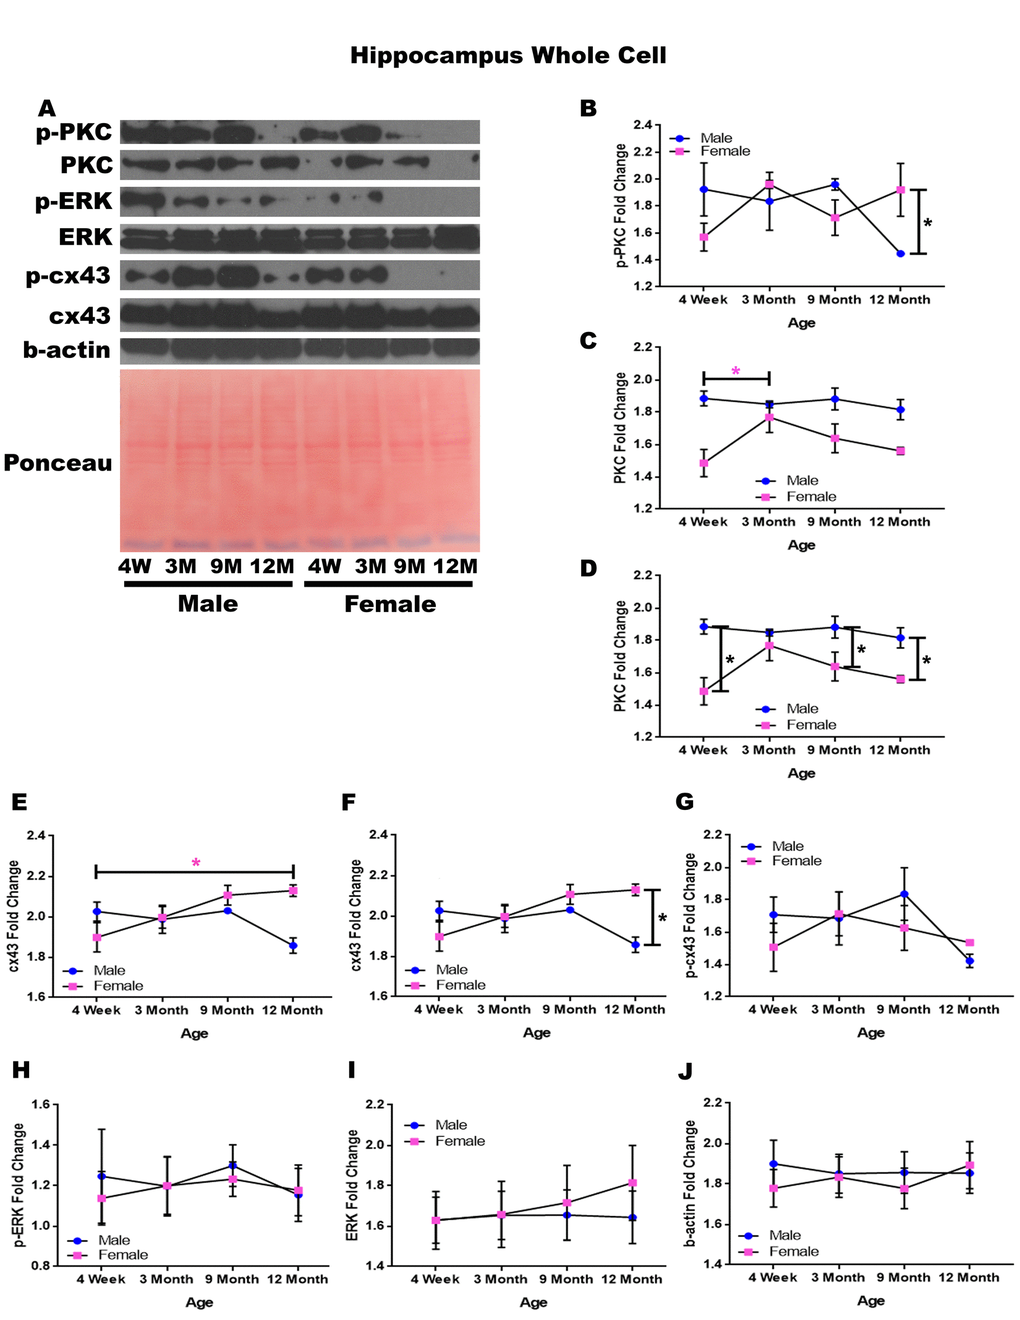
Figure 3.Signaling downstream of estrogen in the hippocampus across age and gender. Representative western blots for each protein of interest and a representative Ponceau stain as a load control (A). Graphical depiction of the fold change for p-PKC (B), PKC comparing age (C), PKC comparing gender (D), cx43 comparing age (E), cx43 comparing gender (F), p-cx43 (G), p-ERK (H), ERK (I), beta-actin (J). Error bars = SEM. 4W = 4 weeks of age; 3M = 3 months of age; 9M = 9 months of age; 12M = 12 months of age. Pink = female; blue = male. ANOVA with Tukey posthoc, * = P<0.05. Pink * = p<0.05 for females only.