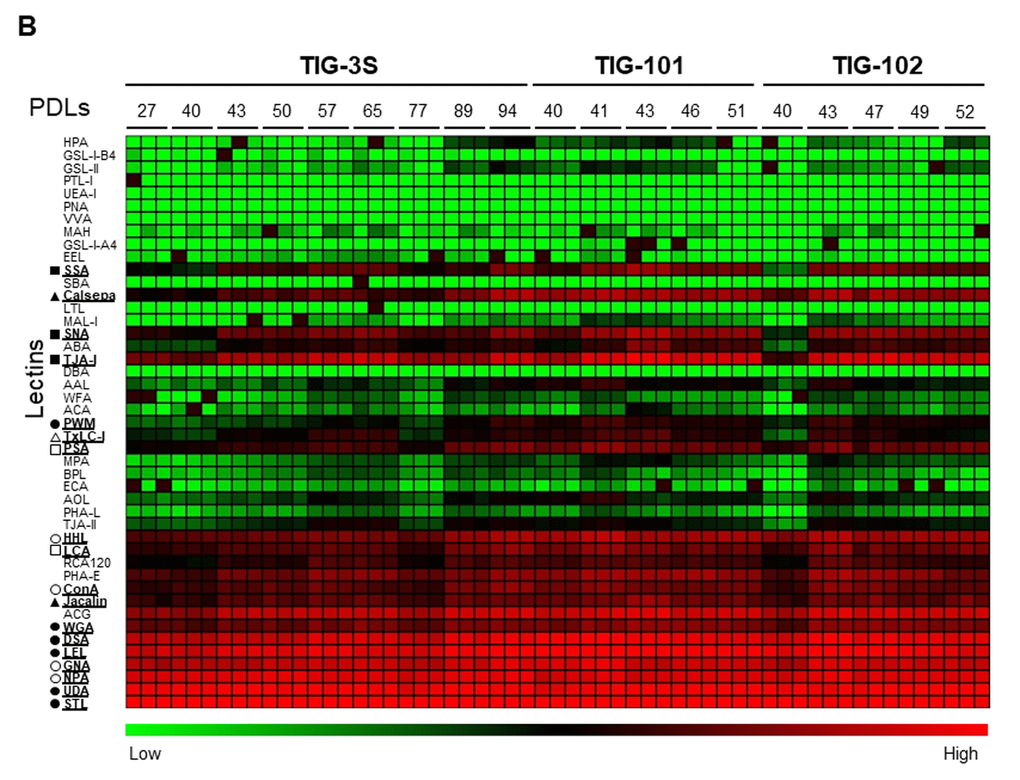
Figure 1B.Lectin microarray analysis for glycoproteins of TIG-3S, TIG-101, and TIG-102 at various PDLs. Heat map of log10-transformed lectin microarray data for intracellular glycans of TIG-3S, TIG-101, and TIG-102 compared to overall lectin-binding profiles at each PDL. Rows show 45 lectins and columns show PDLs of TIG-3S, TIG-101, and TIG-102 (27–94, 40–51, and 40–52, respectively). Lectin microarray data at each PDL were obtained from triplicate measurements. The color scale indicates low (green) to high (red) ratio. Underlines for lectins are shown as specific characters. Signature indicates lectin-binding types beside lectin names (closed circle; N-acetylglucosamine-oligomer; open circle, high-mannose; closed square, α2-6sialic acid; open square, α1-6fucose; closed triangle, galactose or high-mannose; open triangle, mannose- or complex-type N-glycan).