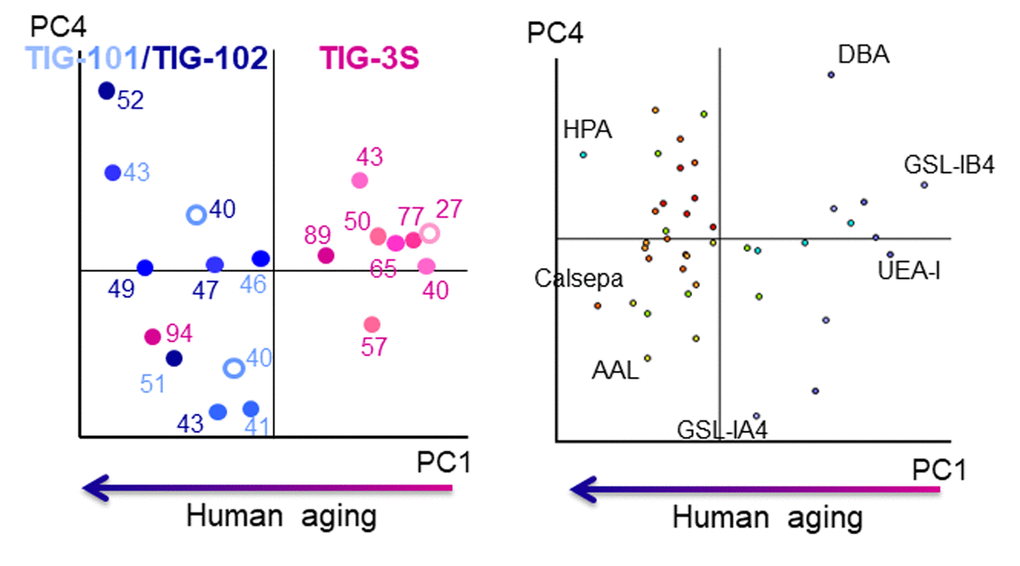
Figure 2.Biplot for PCA analysis of lectin microarray data in TIG-3S, TIG-101, and TIG-102. PC1 represents human aging. Pink, light blue, and dark blue labels represent TIG-3S, TIG-101, and TIG-102 cell lines, respectively. Color gradients (light to dark) of dots and numerals reflect progressive senescence in PDLs (i.e., young to aged). Left panel: cell passage replications, right panel: lectin replications.