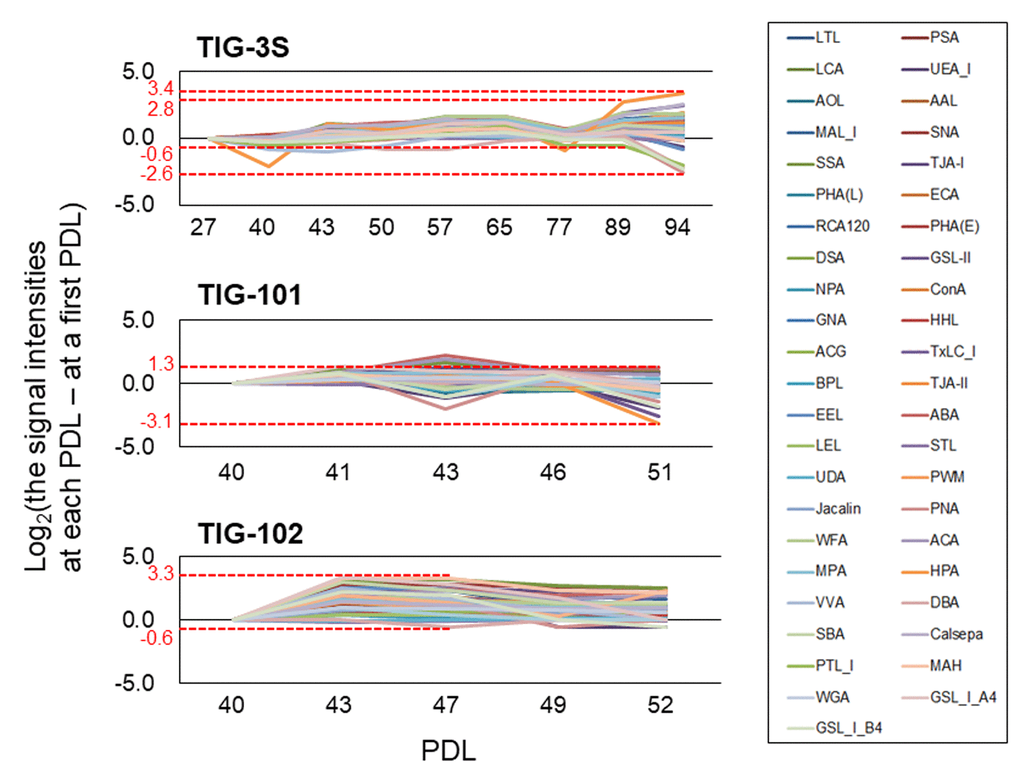
Figure 3.Altered ratios of each lectin in intracellular glycans with cellular senescence. Line graphs show differences between lectin signal intensities at various PDLs and those at the first PDL in TIG-3S, TIG-101, and TIG-102. Changes in ratio were calculated based on average signal intensity at each PDL. Highest and the lowest values of the largest change in ratio are shown for each cell line. Each lectin is shown as a different color in a box.