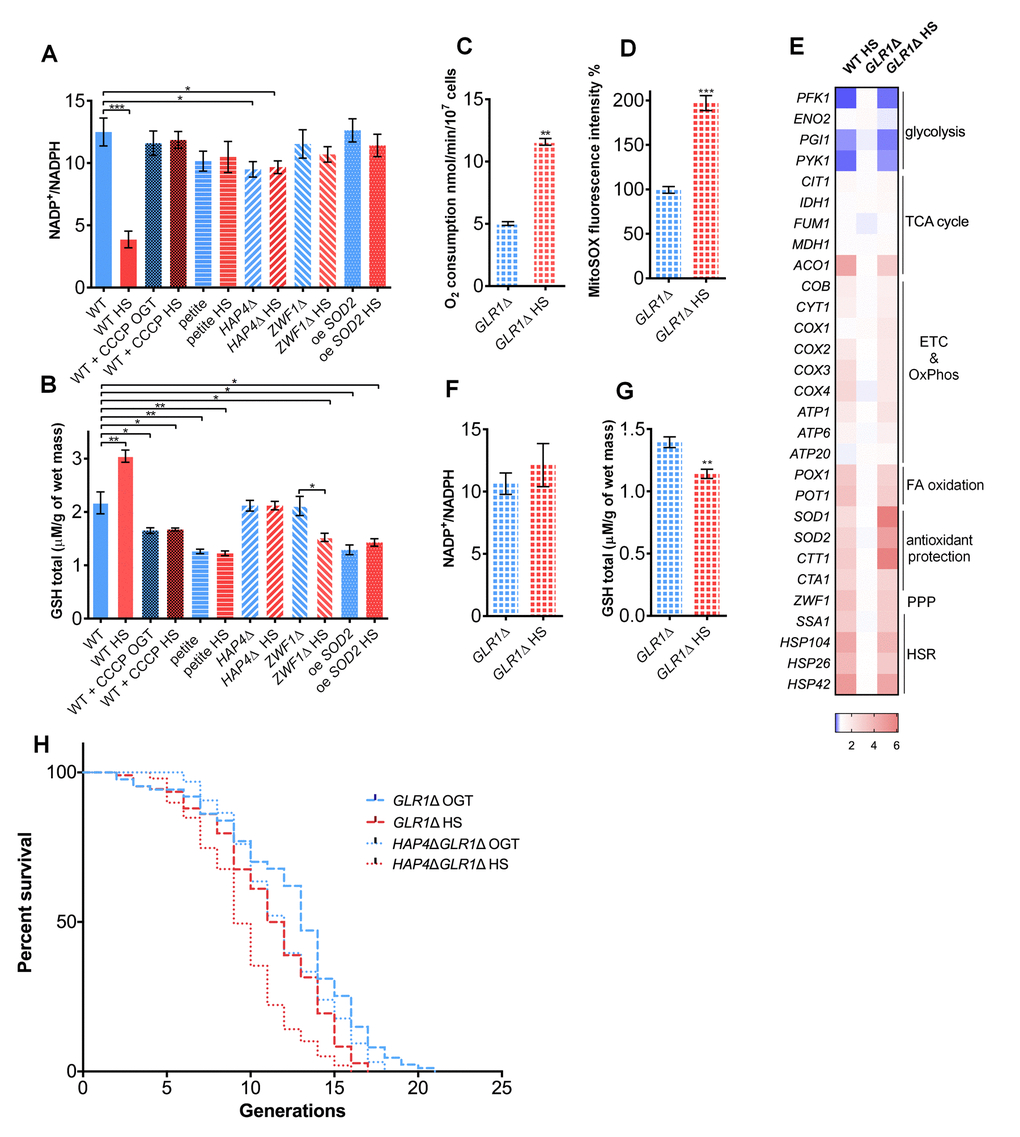
Figure 3.Glutathione recycling is essential for the heat shock induced replicative lifespan extension. (A) NADP+/NADPH ratio decreased in the WT during heat shock, suggesting increased NADPH levels. However, the ratio was unaffected by heat shock in the petite strain, the HAP4Δ strain, in the presence of CCCP, in the strain deficient in G6PD (ZWF1Δ), or in the strain carrying overexpression of SOD2. (B) GSH levels were increased in the WT during heat shock. Heat shock did not induce the GSH levels in the petite, HAP4Δ strain, WT in the presence of CCCP, in the strain deficient in G6PD (ZWF1Δ), or in the strain carrying overexpression of SOD2. (C) Oxygen consumption was increased under heat shock in the GLR1Δ strain. Oxygen uptake was measured polarographically using a Clark-type electrode equipped oxygraph. (D) Mitochondrially produced superoxide (measured by FACS as MitoSOX fluorescence in 10000 cells) was increased in the GLR1Δ strain during heat shock. The results are presented as the percentage of MitoSOX fluorescence detected in WT strain at optimal growth temperature. (E) qPCR measurement of gene expression levels showed that the absence of GLR1 did not affect the heat shock induced metabolic changes, also observed in the WT. Color of the squares on the heat map corresponds to the mean value of the log fold change from three biological and three technical replicates. UBC6 was used for normalization. (F) NADP+/NADPH ratio remained unchanged during heat shock in the GLR1Δ strain. (G) GSH levels decreased during heat shock in the GLR1Δ strain. (H) Mean and maximum replicative lifespan (RLS) were decreased in GLR1Δ following heat shock. RLS of the double mutant HAP4ΔGLR1Δ revealed that GLR1 is epistatic to HAP4 under the conditions of mild heat shock. The number of curated cells if 87 for GLR1Δ, 107 for GLR1Δ HS, 96 for HAP4ΔGLR1Δ and 99 for HAP4ΔGLR1Δ HS. P value is <0.0001 (Mantel-Cox). Unless otherwise stated, data in graphs are mean ± SEM from three biological and three technical replicates. ***P < 0.001; **P < 0.01; *P < 0.05 (ANOVA plus post hoc).