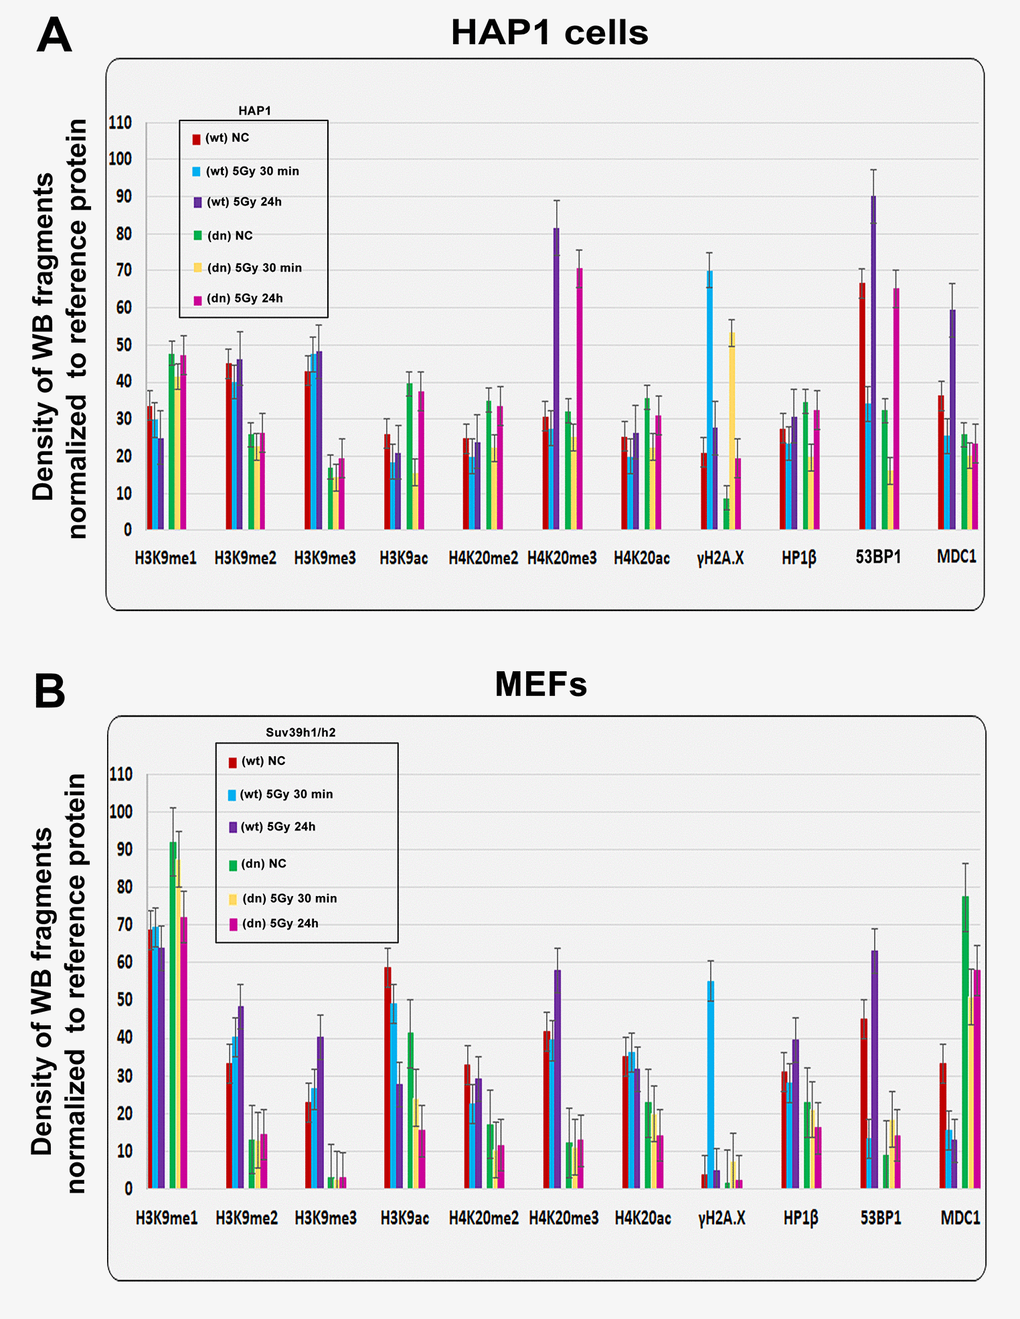
Figure 2.Quantification of western blot data on selected histone markers in non-irradiated and γ-irradiated cells. Using ImageJ and ImageQuant TL software, the levels of the following proteins (originated from Fig. 1A, B) were quantified: H3K9me1, H3K9me2, H3K9me3, H3K9ac, H4K20me2, H4K20me3, H4K20ac, γH2AX, HP1β, 53BP1, and MDC1. The levels of modified histones were normalized to those of total H3 histones, and those of DDR-related proteins were normalized to those of α-tubulin. Quantification was performed in the following samples: (A) HAP1 wt and HAP1 mutant cells and (B) wt MEFs and Suv39h1/h2-deficient fibroblasts (MEFs).
Figure 2 — H3K9me3 and H4K20me3 represent the epigenetic landscape for 53BP1 binding to DNA lesions | Aging