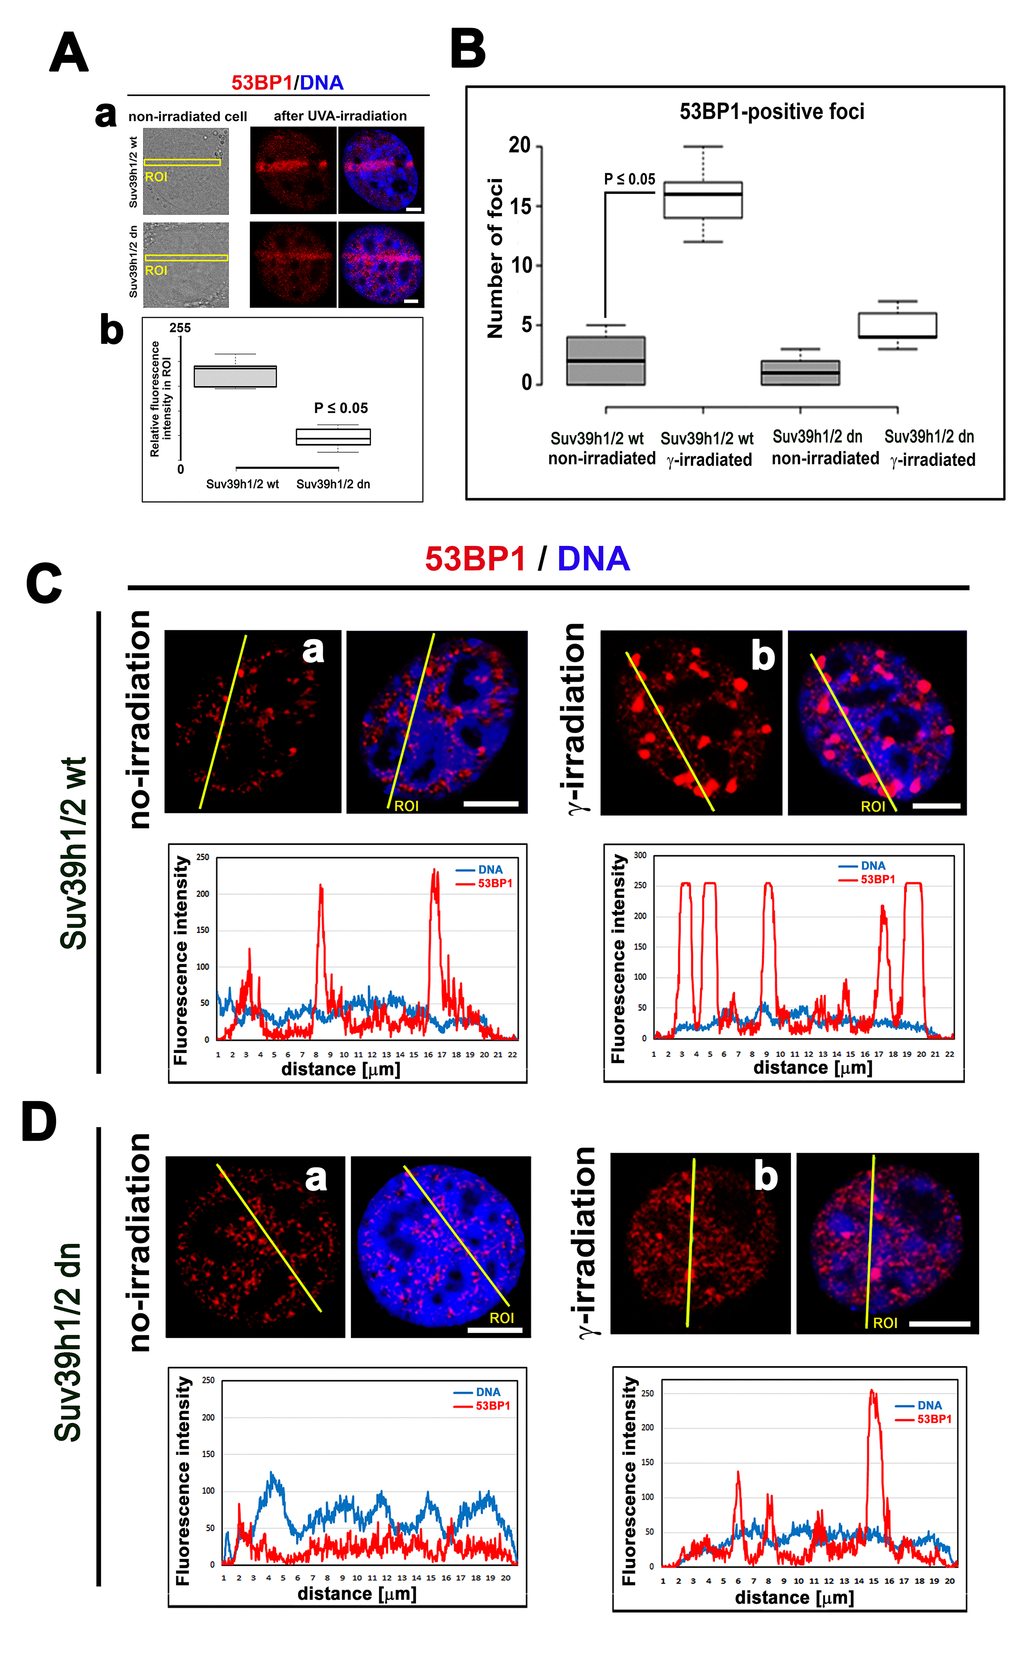
Figure 3.The nuclear distribution pattern of 53BP1 protein. (A) Recruitment of 53BP1 to locally micro-irradiated chromatin in (a) Suv39h1/h2 wt and (b) Suv39h1/h2 dn fibroblasts. Quantification using LAS AF software in panel (b) shows that the level of the 53BP1 protein at UVA-irradiated ROIs was reduced in Suv39h1/h2 dn MEFs. For statistical analysis, the Student’s t-test was used; the difference in the protein levels is statistically significant at P≤0.05. (B) An average number of 53BP1-positive foci was significantly increased in γ-irradiated Suv39h1/h2 wt MEFs compared with those in the non-irradiated wt counterpart. In Suv39h1/h2 dn MEFs, γ-irradiation did not significantly change a number of 53BP1-positive repair foci. Student’s t-test was used for statistical analysis, and statistical significance was defined as P≤0.05. The distribution of 53BP1 in (C) in (a) non-irradiated and (b) γ-irradiated wild-type MEFs and (D) (a) non-irradiated and (b) γ-irradiated Suv39h1/h2 dn MEFs. Scale bars represent 10 µm.