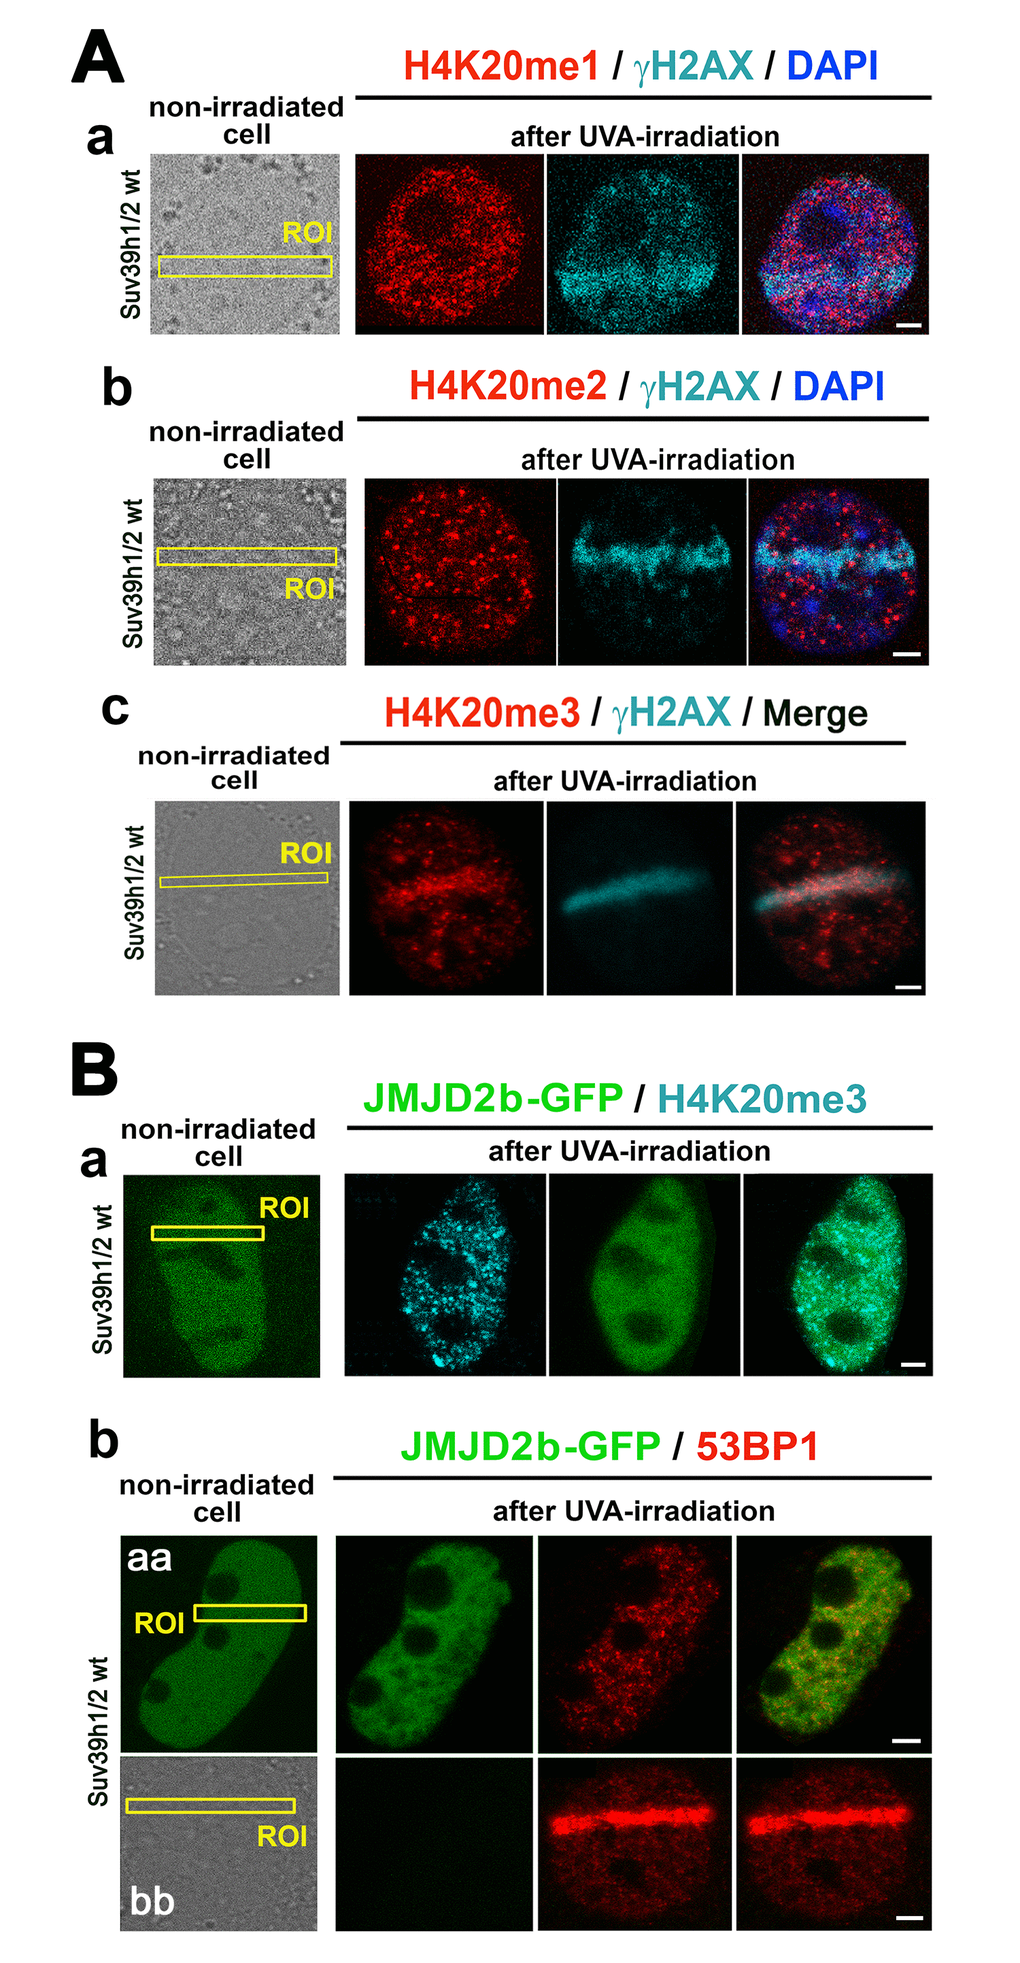
Figure 6.The nuclear distribution pattern of H4K20me1/me2/me3 at DNA lesions. (A) The levels of (a) H4K20me1 (red) in γH2AX-positive DNA lesions (magenta), (b) H4K20me2 (red) in γH2AX-positive DNA lesions (magenta), and (c) H4K20me3 (red) in DNA lesions studied in parallel with γH2AX (magenta). (B) The level of (a) H4K20me3 and (b) 53BP1 in micro-irradiated ROI of the cells over-expressing JMJD2b histone demethylase, tagged by GFP. Panels Bb-aa show low level of 53BP1 at micro-irradiation induced DNA lesions in cells over-expressing GFP-tagged JMJD2b and panel Bb-bb documents 53BP1 recruitment to DSB sites in the cells with a normal expression of JMJD2b. Scale bars in all panels represent 5 µm.