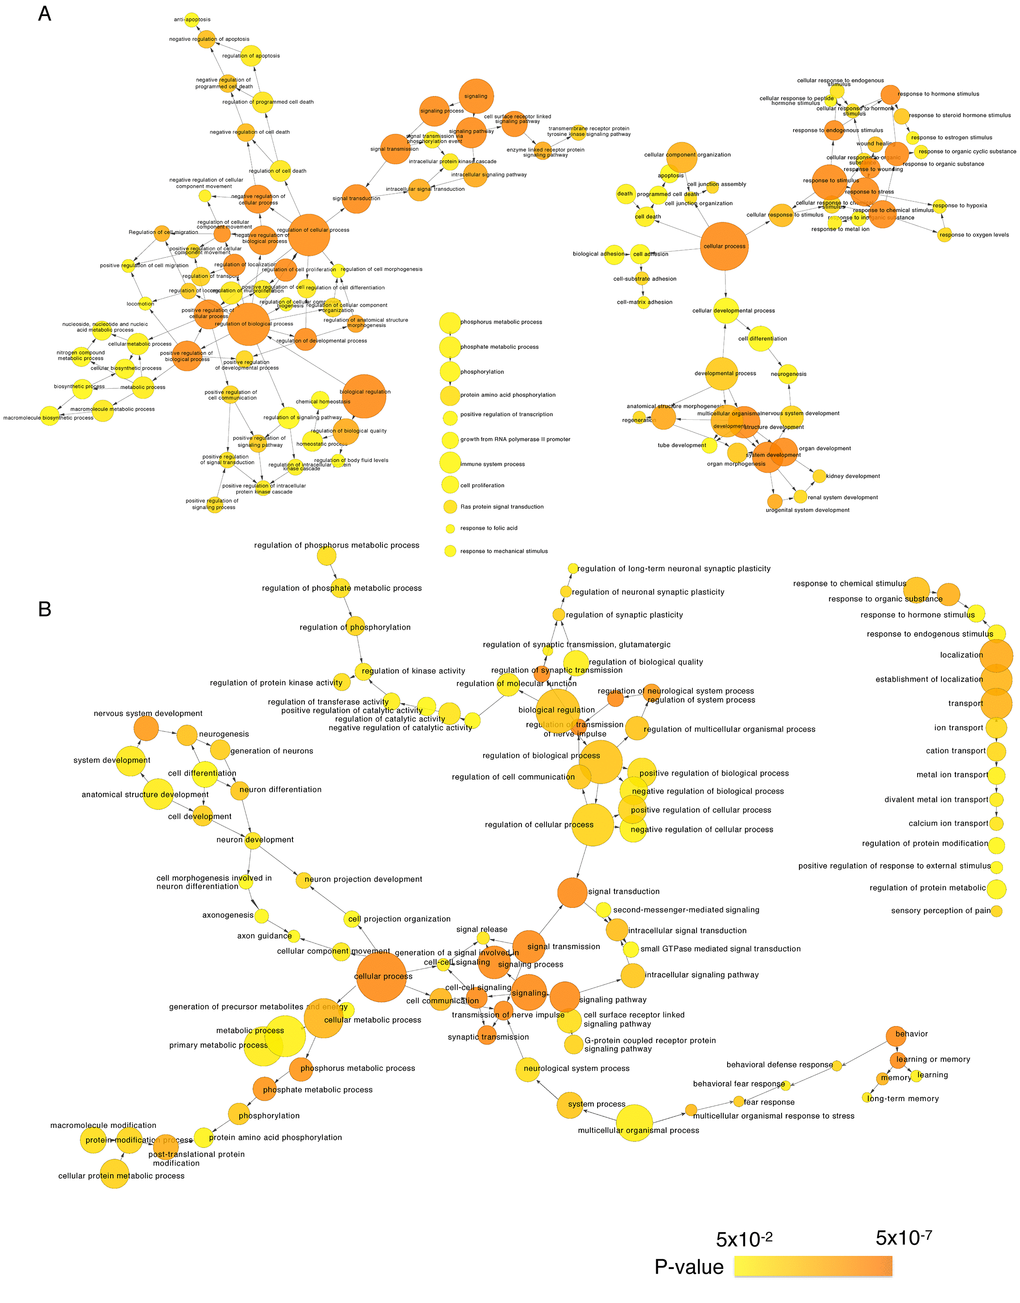
Figure 4.Gene Ontology analysis of significantly age-associated genes in the frontal cortex. Shown is a BiNGO (the Biological Network Gene Ontology tool) analysis depicting upregulated (A) and downregulated (B) genes in over-represented categories in the ontology of biological processes. The size of the nodes is proportional to the number of genes in the test set that are annotated to that node. Colored nodes are significantly over-represented along a color scale ranging from yellow (p = 0.05) to dark orange (p = 5.00E-7).