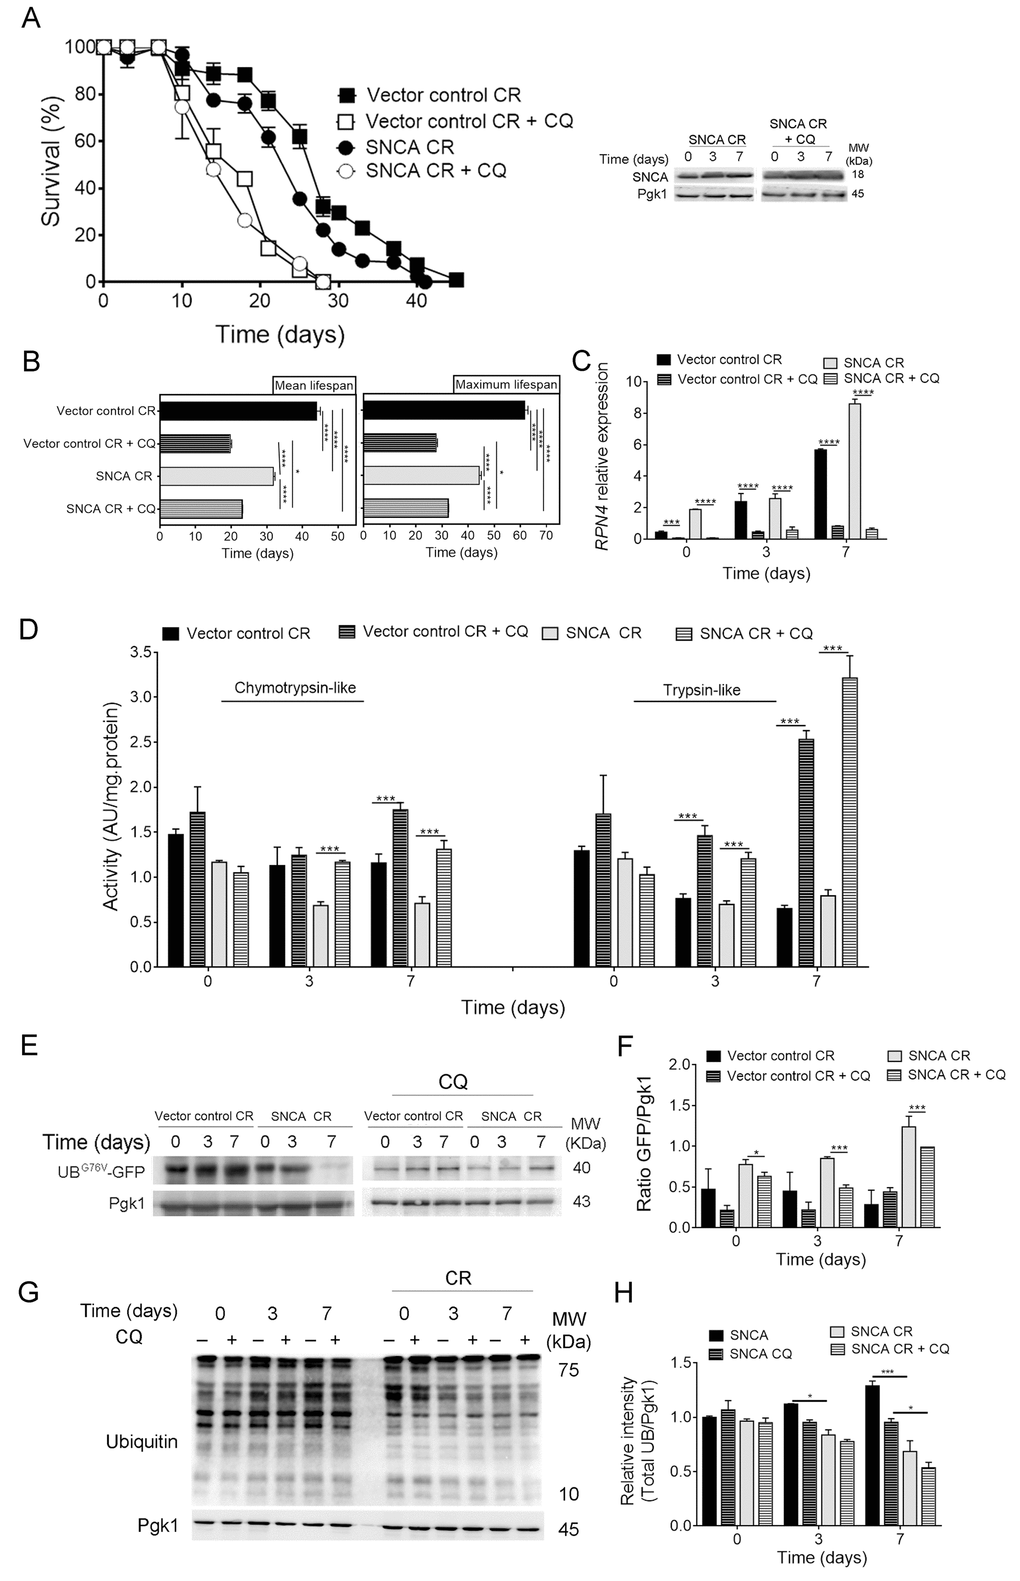
Figure 2.Autophagy inhibition leads to upregulation of the ubiquitin-proteasome system activity in α-synuclein (SNCA)-expressing cells under caloric restriction. (A) Chronological lifespan (CLS) and SNCA levels of SNCA-expressing stationary wild type cells, under caloric restriction (CR, 0.5% glucose) conditions, in the presence or absence of chloroquine (CQ), an inhibitor of autophagy. (B) Mean (50% survival) and maximum (10% survival) lifespans determined from curve fitting of the survival data from CLS. Significance was determined by two-way ANOVA (*p≤0.05, ****p≤0.0001) between cells grown under CR conditions expressing vector control or SNCA in the presence or absence of CQ. (C) RPN4 mRNA relative expression levels as described in the legend of Figure 1. (D) Chymotrypsin- and trypsin like activities. The assay was normalized to the total protein amount. (E) UPS activity measured by monitoring the ubiquitin/proteasome-dependent proteolysis of the short-lived protein UBG76V-GFP. GFP was detected by Western blotting using a GFP-specific antibody. (F) Graphical representation of GFP/Pgk1 obtained by densitometric analysis. (G) Ubiquitination profile determined by Western blotting using an anti-mono and polyubiquitination antibody. (H) Graphical representation of the intensity of total UB/Pgk1 obtained by densitometric analysis. Statistical significance represented in (C), (D), (F) and (H) was determined by Student's t-test (*p≤0.05, ***p≤0.001, ****p≤0.0001) comparing caloric restricted vector control or SNCA-expressing cells in the presence or absence of CQ. Data represents mean ± SEM of at least three biological independent replicas. The error bars represent the standard error of the mean (SEM).