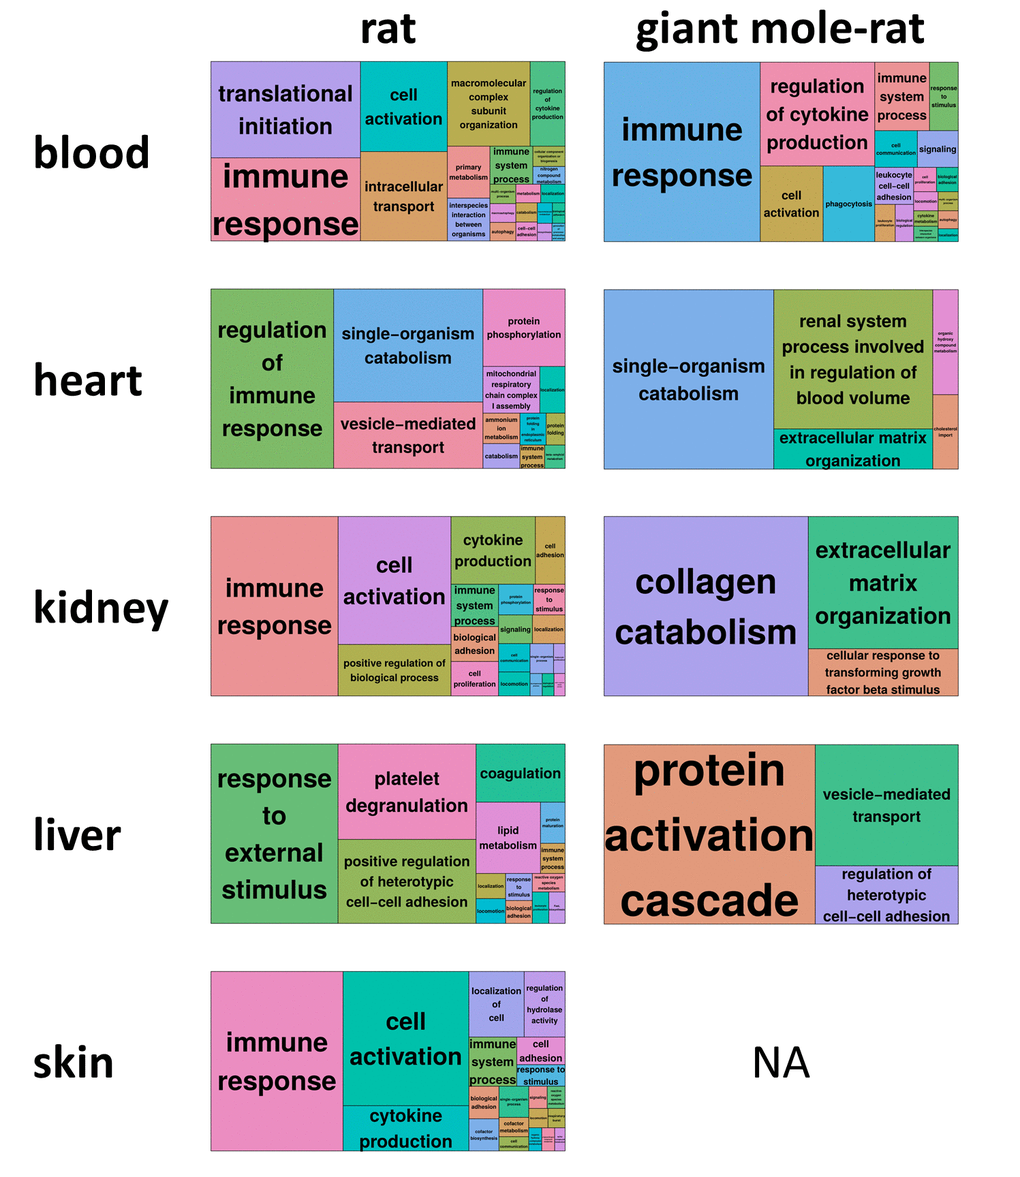
Figure 2.REVIGO treemap summary of gene ontology processes that are significantly enriched (false discovery rate [FDR] < 0.05) for differentially expressed genes during aging. For each species and tissue, the superclusters, i.e., the highest summarization level of gene ontology processes, as identified by REVIGO [13] are shown. Each rectangle painted with a unique color represents a supercluster. The colors only serve to distinguish superclusters. The size of the rectangles represents their p-value, i.e., largest rectangles represent the most significant superclusters. For giant mole-rat skin, no treemap could be generated since no gene ontology process was significantly enriched (Fig. 1b). Corresponding REVIGO treemap summarizations are provided as high-resolution Figures S1-S9, showing also the clusters within the superclusters.