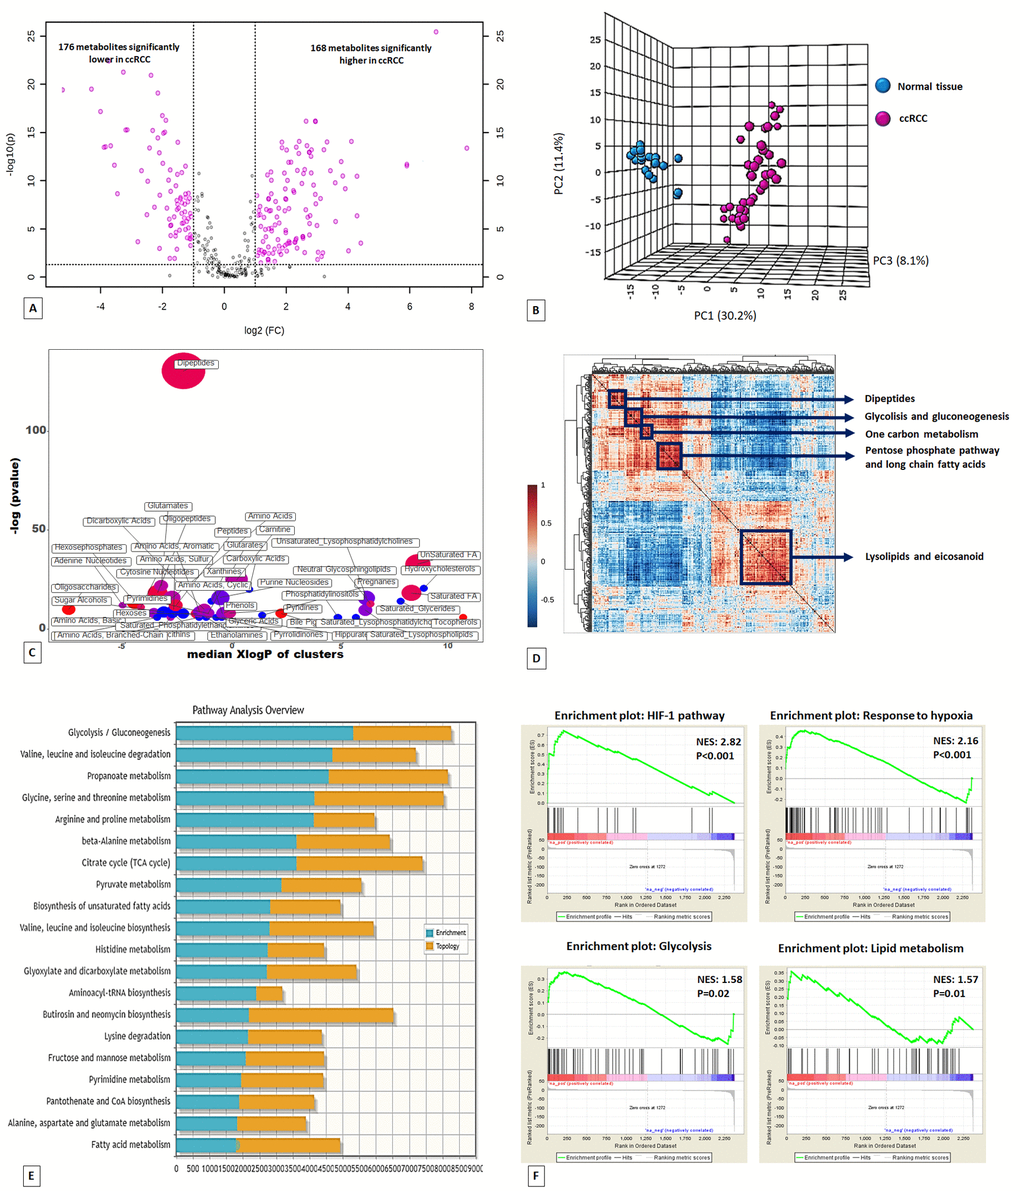
Figure 1.Volcano plot of the 516 metabolites profiled. 344 exhibited significant differential abundance when comparing ccRCC to normal kidney tissues (A). Principal component analysis (PCA) of global tissue metabolome demonstrated that the two groups (ccRCC vs normal renal tissue) were clearly distinguishable (B). ChemRICH set enrichment statistical plot. Each node reflects a significantly altered cluster of metabolites. Node sizes represent the total number of metabolites in each cluster set. The node color scale shows the proportion of increased (red) or decreased (blue) compounds in tumor compared to normal tissue. Purple color nodes have both increased and decreased metabolites (C). Hierarchical cluster analysis and heatmap of metabolite-metabolite correlation matrix. Metabolite clusters are indicated (D). Integrated metabolic pathway enrichment analysis. The stacked bars show a summary of the joint evidence from enrichment and topology analyses (E).Gene Set Enrichment Analysis (GSEA) of the GSE47032 dataset (F).