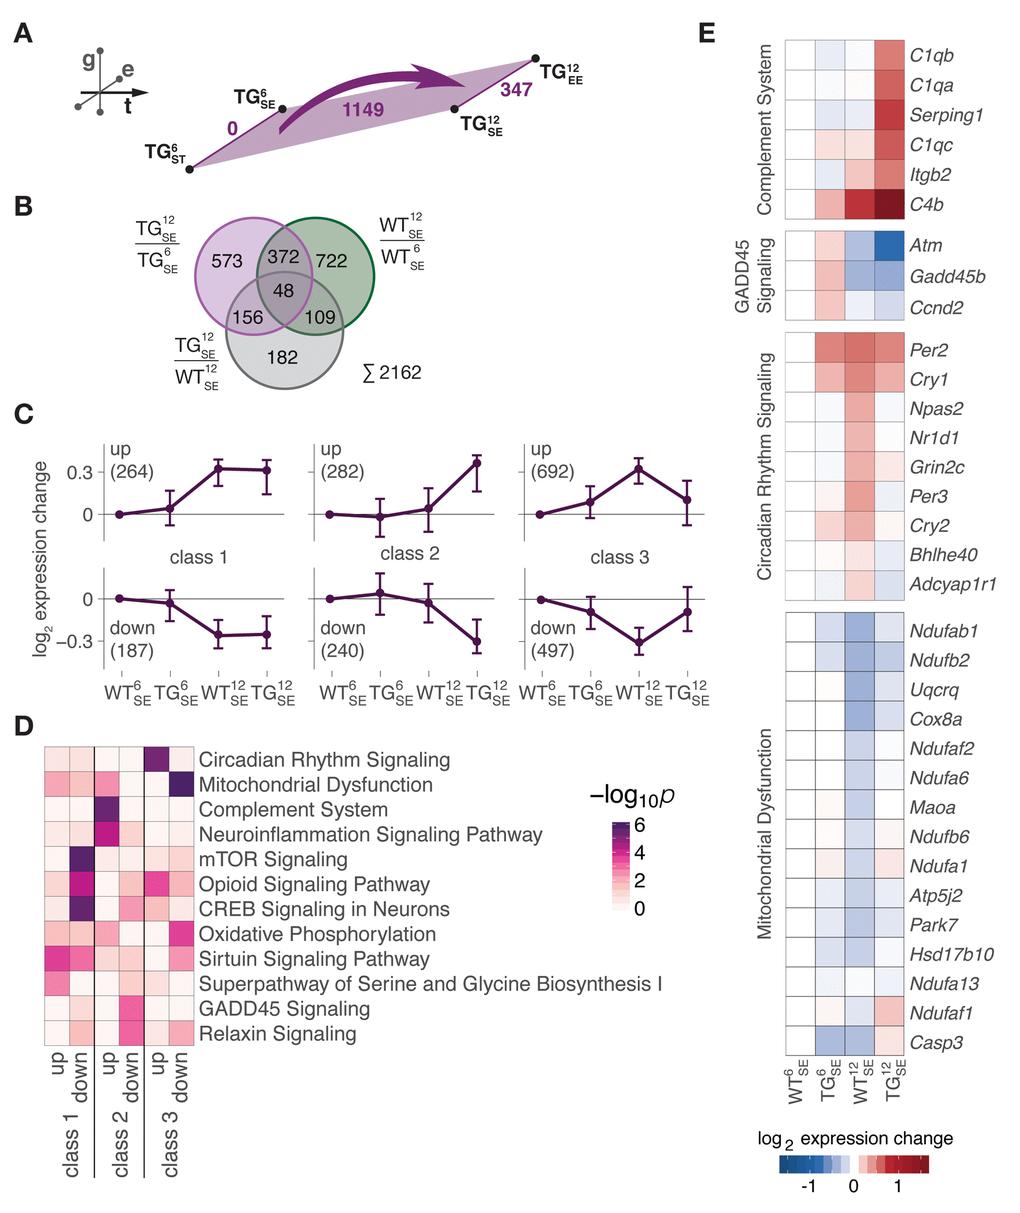
Figure 3.Midlife gene expression trajectories were disturbed through SNCA overexpression in two distinctive modes. (A) Schematic diagram showing number of DEGs derived from comparing 6- and 12-month-old WT (green) and TG (purple) mice. (B) Venn diagram putting midlife expression changes in TG animals (1149 DEGs in (A) in perspective to midlife expression changes in WT animals (1251 DEGs, see Fig. 2C) and SNCA-induced disturbances (495 DEGs, see Fig. 1A), totalling to 2162 age-SNCA-regulated DEGs. (C) Partitioning of 2162 age-SNCA-regulated DEGs based on their gene expression pattern in 6- and 12-month-old WT and TG mice in SE (see Fig. S3 for details). Subplots show longitudinal expression medoids and standard deviation of six primary gene clusters grouped into three classes. Number of DEGs per cluster in brackets. (D) Canonical pathway analysis for 2162 DEGs according to their cluster/class assignment (see C). Two most significant terms per cluster selected, and their significance values across all clusters hierarchically ordered. (E) Hierarchically clustered expression changes (relative to WT6SE) for DEGs attributed to the most significantly overrepresented pathway per cluster in class 2 and 3.