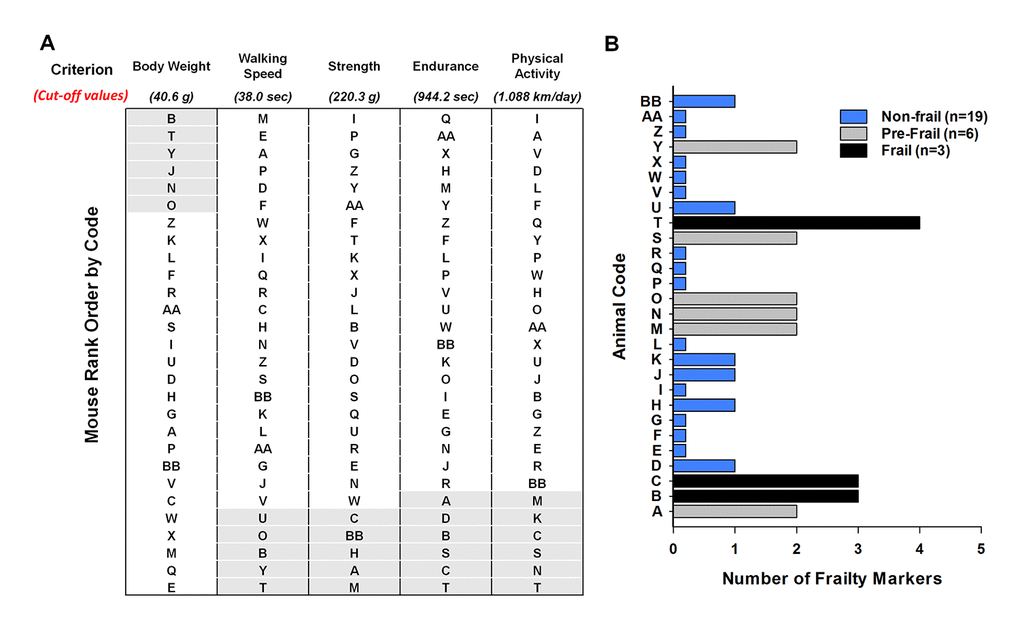
Figure 2.Frailty status of mice at 23 months of age. (A) The mice were coded A-Z, AA, and BB and rank – ordered by performance with the exception of body weight. For body weight the mice were ranked from heaviest to lightest. The cut-off values of each criterion (body weight, walking speed, strength, endurance and physical activity) are shown in parentheses. The shaded areas (light grey) identify the mice in the bottom 20% for performance and the top 20% for body weight. (B) Number of frailty markers for each mouse at 23 months of age. Frailty was defined if the mouse presented with three or more of the criterion markers (below or above the cut-off points); whereas, pre-frailty was designated if the mouse presented with two frailty markers. Mouse B, C, and T were identified as frail (black). Mouse A, M, N, O, S, and Y were identified as pre-frail (grey). The remaining mice were identified as non-frail (blue).