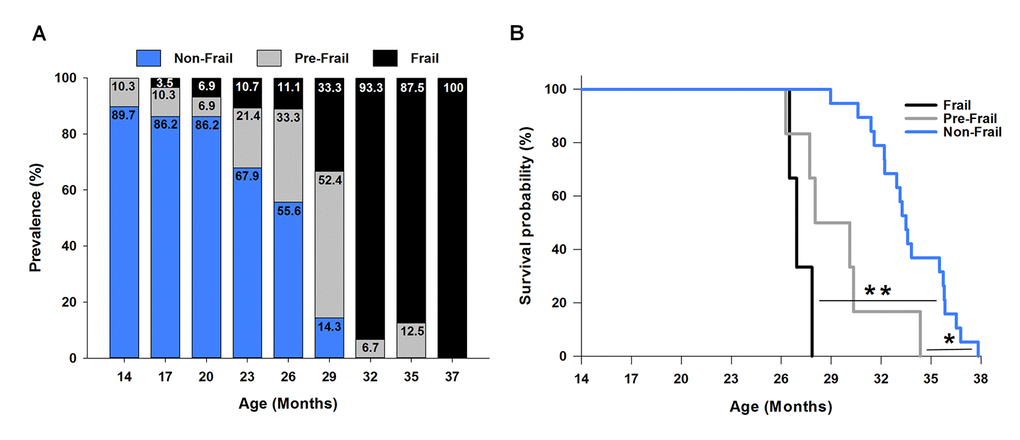
Figure 3.Frailty: onset, prevalence and mortality. (A) The prevalence of frailty across the lifespan. The frailty status was based on the cut-off values of each criterion determined at 23 months of age (Figure 2). The numbers within each bar graph represent the percentage associated with frail (black), pre-frail (grey), and non-frail (blue) for each age. The onset of frailty was identified at 17 months of age (3.5% prevalence). (B) Kaplan-Meier survival curves estimated over the lifespan by frailty status. * indicates p<0.05 comparing pre-frail (grey curve) to non-frail (blue curve). ** indicates p<0.001 comparing frail (black curve) to non-frail (blue curve).