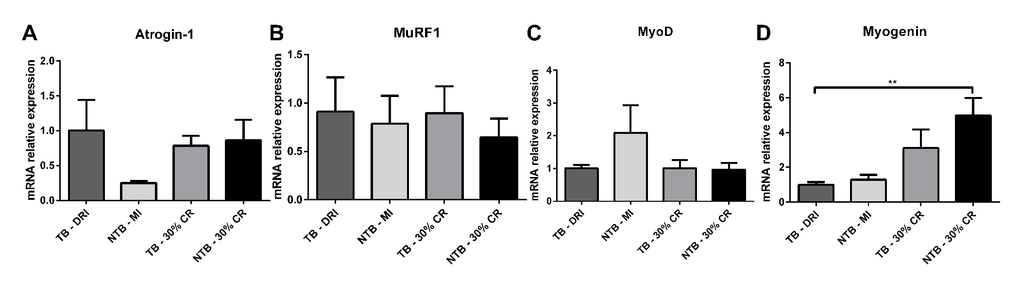
Figure 5.mRNA expression levels in cachectic muscle. Bar graphs depicting the mean ± SEM mRNA expression levels in gastrocnemius muscle of (A) Atrogin-1, (B) MuRF1, (C) MyoD and (D) Myogenin in C26 tumor-bearing (TB) male CD2F1 mice with ad libitum access to chow (dietary reference intake [DRI], n = 10); C26 TB mice on a 30% caloric restriction (CR, n = 10) diet; non-tumor bearing (NTB) mice with matched intake (MI, n = 10); NTB mice on a 30% caloric restriction (n = 10). Multiple group comparisons were done by one-way ANOVA with a Bonferroni’s post hoc test. All groups were compared against TB – DRI mice. Asterisk brackets are displayed for significant results only. * p < 0.05 ** p < 0.01 *** p < 0.001.