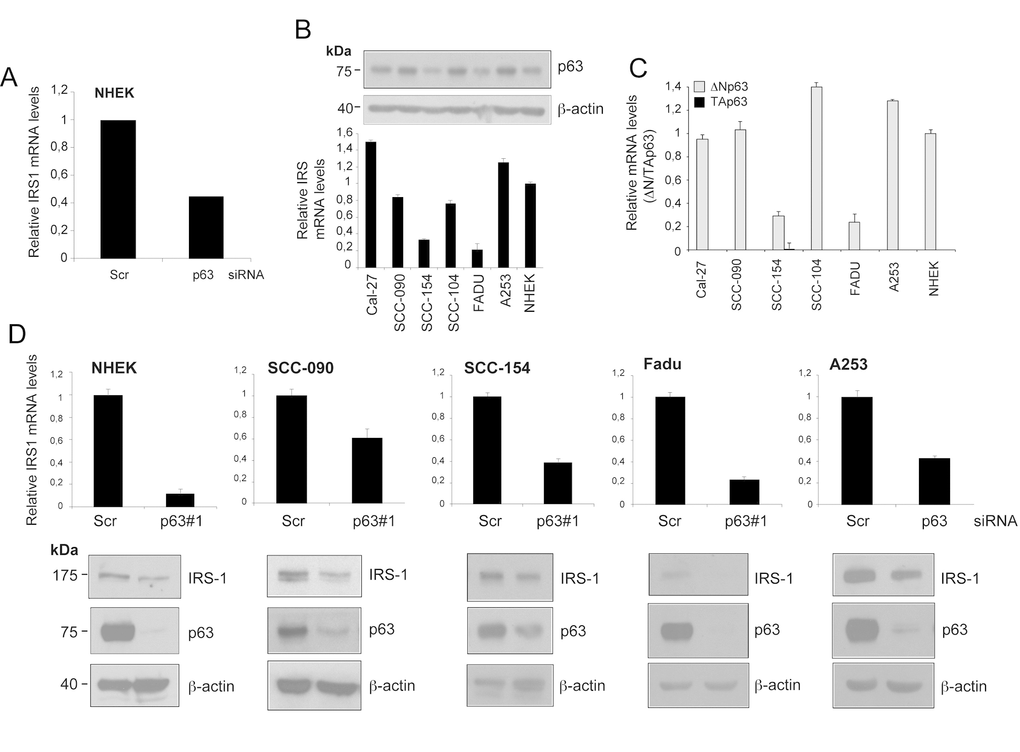
Figure 1.IRS1 expression is decreased upon down-regulation of p63 in HNSCC cell lines. (A) Relative expression levels of Irs1 as measured by RNA-Seq analysis of p63-depleted NHEK. Cells were transfected with p63 (sip63#1) or scrambled control (siScr) siRNAs. P-value = 0,005. (B) The amount of p63 was measured in NHEK and HNSCC cell lines by western blot analysis (upper panel). IRS1 transcript levels were analysed by RT-qPCR (lower panel). RT-qPCR was performed in duplicate. IRS1 expression was normalized on Tbp housekeeper and plotted relative to NHEK cells (mean ± s.d.). (C) The transcript levels of TAp63 (black box) and ΔNp63 (grey box) were measured in NHEK and HNSCC cell lines by RT-qPCR. RT-qPCR was performed as above. Gene expression was normalized on Tbp housekeeper and plotted relative to NHEK cells (mean ± s.d.). (D) RT-qPCR analysis (upper panels) of two independent experiments performed in duplicates for Irs1 transcripts in NHEK and HNSCC cells transfected with scrambled control (siScr) or p63 (sip63#1) siRNAs. Cells were harvested 48 h after transfection. qRT-PCR was performed as above. Values are normalized to Tbp and plotted relative to control cells (mean ± s.d.). Western blot analysis for IRS1 and p63 in HNSCC cells transfected as above. Cells were harvested 48 h after transfection. β-actin served as loading control.