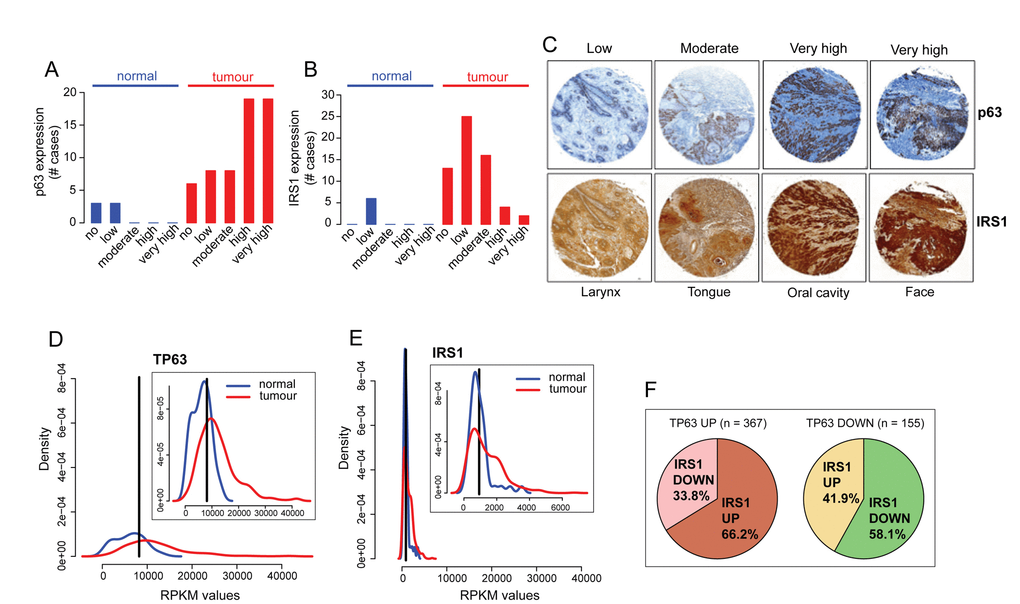
Figure 4.p63 and IRS1 expression patterns are positively correlated in HNSCC patients. (A-C) Tissue sections were stained with anti-p63 and IRS1 antibodies. The scores for the percentage of p63 and IRS1 positive cells and those for the expression intensities were combined to calculate immunoreactive scores (IRSs) summarised in Table S1. According to the IRS, patients were assigned to five groups: 0 (no expression), 0,5 (low expression), 1 (moderate expression), 1,5-2 (high expression), and 2,5-3 (very high expression). The distribution of p63 and IRS1 expression in HNSCC specimens and normal tissues is shown in A, B. (C) Representative micrographs of immunohistochemical staining of p63 and IRS1 in HNSCC primary tumours (magnification: 40x). (D-E) Density distribution of RPKM values in normal (n=44; blue) and tumour (n=522: red) samples for p63 and IRS1 transcripts. Top right panels show an enlargement of the overlapping curves. Vertical black line indicates the optimal cutpoint between tumour and normal RPKM distributions, identified using OptimalCutpoints R package [96] P-value < 1.074e-10 for p63 and P-value < 0.004 for IRS1. (F) Pie charts representing the proportion of tumour samples with IRS1 up- or down-regulated in p63 up (left) and p63 down-regulated (right) tumour samples. Statistical significance of the contingency table represented by the 4 sub-dataset of tumour samples is p-value= 4.293e-07 (Fisher’s exact test). Statistical tests (Wilcoxon and Fisher’s exact tests) on TCGA gene expression data were performed in R.