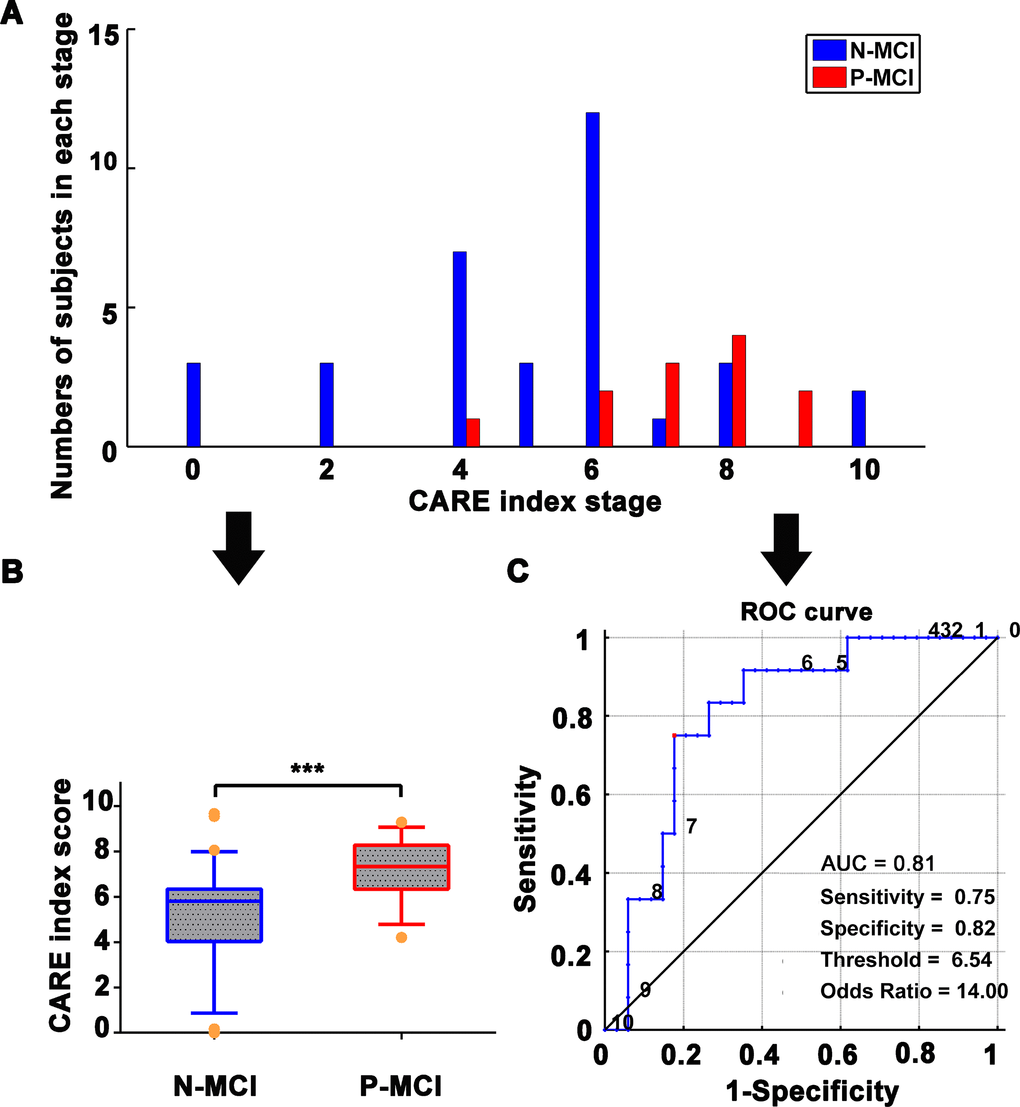
Figure 2.Classification of N-MCI and P-MCI in the ADNI dataset by the CARE index. (A) Number of patients in each diagnostic category at each CARE index stage at baseline; data from the ADNI dataset. N-MCI subjects are represented in blue and P-MCI subjects in red. Each CARE index stage on the x-axis corresponds to the occurrence of a new biomarker transition event. Stage 0 corresponds to no events having occurred and stage 10 to all events having occurred. The optimal temporal sequence, Soptimal, of the 10 AD Biomarkers was used to calculate the CARE index. The Soptimal was estimated by the event-based probabilistic model. The Soptimal biomarker sequence is 1) increased HIP FCI, 2) decreased PCC FCI, 3) decreased Aβ concentration, 4) increased p-tau concentration, 5) decreased MMSE score, 6) increased ADAS score, 7) decreased HIP GMI, 8) decreased AVLT score, 9) decreased FG GMI, and 10) increased FG FCI. The details of the calculation of the Soptimal biomarker sequence and CARE index score can be found in our previously published studies [16] and are also provided in SI Methods. (B) Boxplot representing the distribution comparison of N-MCI and P-MCI subjects. For each boxplot, the band represents the median value, the box represents the interquartile range, and whiskers show the range of data without outliers (an outlier being defined as any value that lies more than one-and-a-half times the interquartile range from either end of the box). Differences were assessed between the two groups using Mann-Whitney tests; ***p < 0.001. (C) The power of receiver operating characteristic (ROC) curve of the CARE index “classifier” in classifying the diagnosis of P-MCI versus N-MCI at baseline in the ADNI dataset. Note: Numbers next to the ROC curve indicate the CARE index threshold. The values of sensitivity, specificity, and odds ratio in lower right of the figure present the optimum values under the optimum CARE index threshold (red piont). Abbreviations: ADNI, Alzheimer’s Disease Neuroimaging Initiative; AD, Alzheimer’s disease; P-MCI, progressive MCI, including MCI subjects who progressed to AD-type dementia at the three-year follow-up; N-MCI, nonprogressive MCI, including MCI subjects who had not progressed to dementia at the three-year follow-up; MCI, mild cognitive impairment; CARE, characterizing AD risk event; ROC, receiver operating characteristic; AUC, area under curve; Opt, optimum; HIP, hippocampus; PCC, posterior cingulate cortex; FG, fusiform gyrus; FCI, functional connectivity indices; GMI, gray matter indices; Aβ, β-amyloid; p-tau, phosphorylated tau; MMSE, Mini-Mental State Examination; ADAS-Cog, Alzheimer’s Disease Assessment Scale-Cognitive Subscale; AVLT, Rey Auditory Verbal Learning Test.