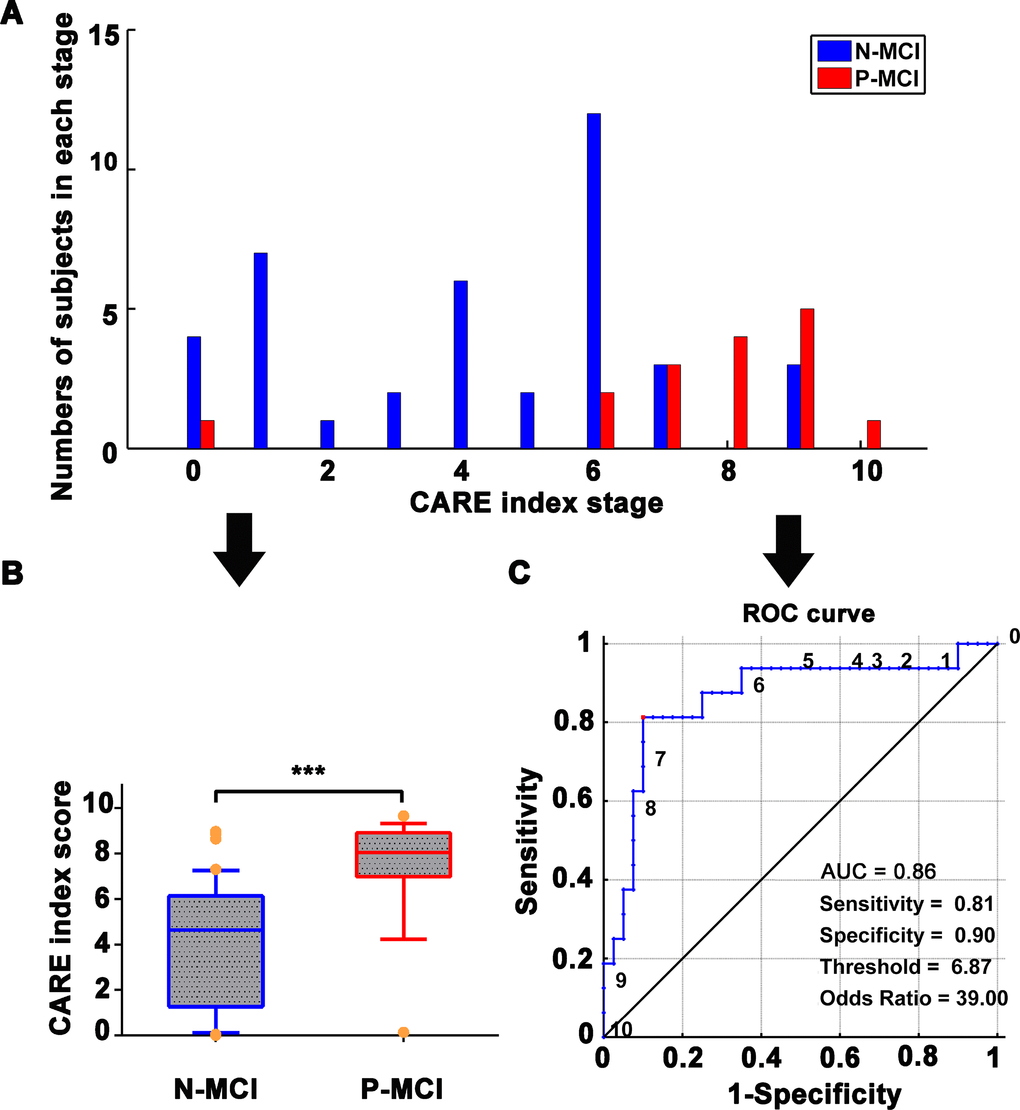
Figure 3.Independent validation with NADS dataset for prediction of N-MCI and P-MCI subjects using the CARE index. (A) Number of patients in each diagnostic category at each individual CARE index stage at baseline from the NADS dataset. N-MCI subjects are represented in blue and P-MCI subjects in red. (B) Boxplot representing the distribution comparison of N-MCI and P-MCI subjects. For each boxplot, the band represents the median value, the box represents the interquartile range, and whiskers show the range of data without outliers (an outlier being defined as any value that lies more than one and a half times the interquartile range from either end of the box). Differences were assessed between the two groups using Mann-Whitney tests; ***p < 0.001. (C) The power of the ROC curve of the CARE index “classifier” in predicting P-MCI versus N-MCI at baseline in the NADS dataset. Note: Numbers next to ROC curve indicate CARE index threshold. The values of sensitivity, specificity, and odds ratio in lower right of the figure present the optimum values under the optimum CARE index threshold (red piont). Abbreviations: NADS, Nanjing Aging and Dementia Study; AD, Alzheimer’s disease; P-MCI, progressive MCI, including MCI subjects who progressed to AD-type dementia at the three-year follow up; N-MCI, nonprogressive MCI, including MCI subjects who had not progressed to dementia at the three-year follow up; MCI, mild cognitive impairment; CARE, characterizing AD risk event; ROC, receiver operating characteristic; AUC, area under curve.