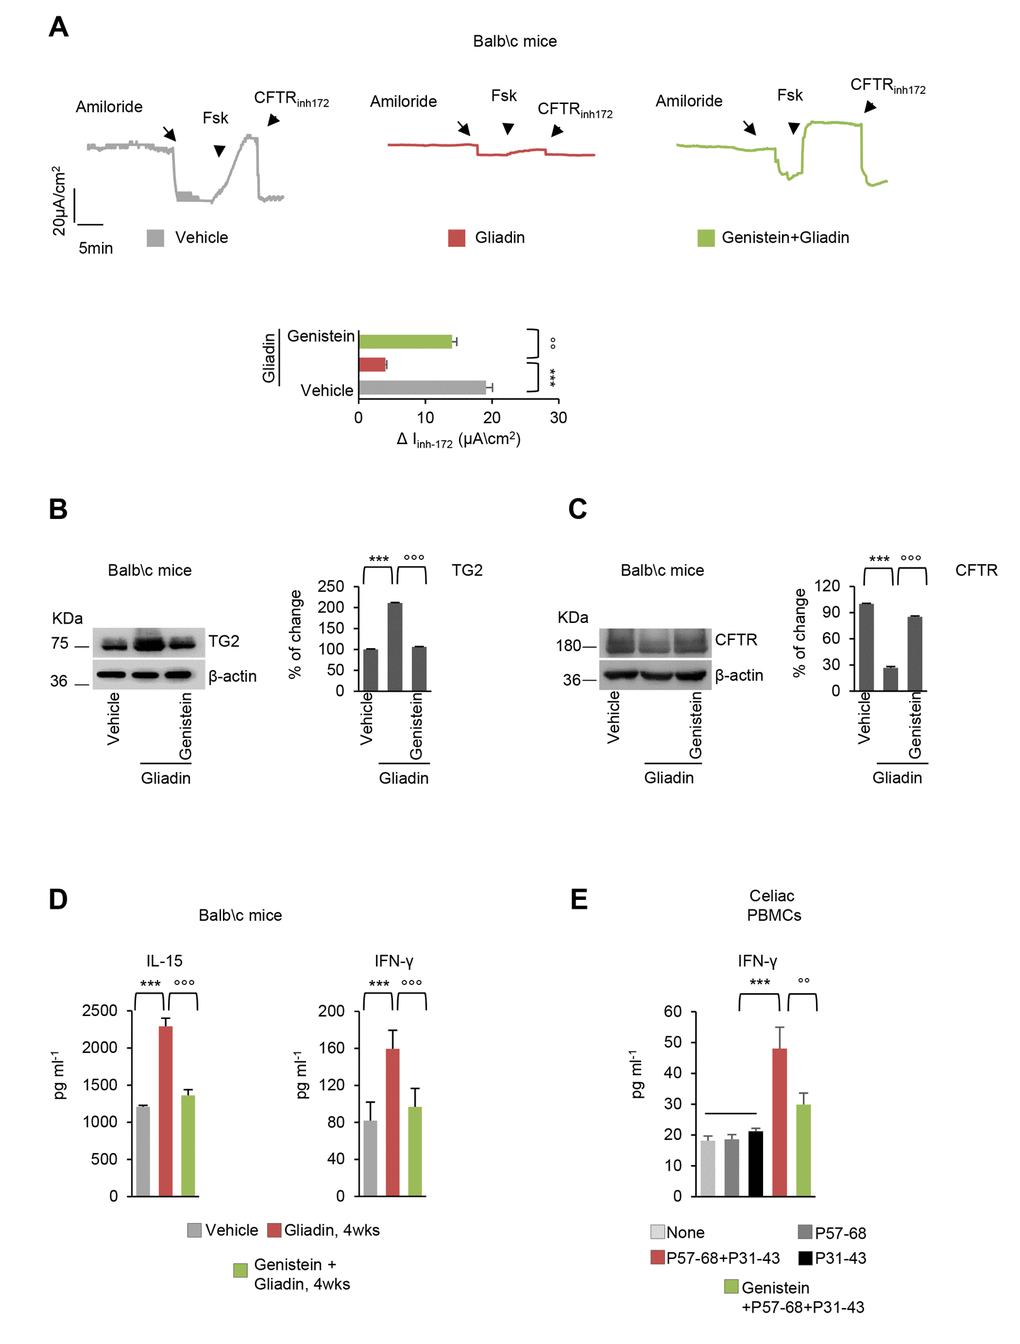
Figure 5.Genistein protects gliadin-sensitive mice and celiac PBMC from the effects of gliadin. (A-D) BALB/c mice fed with a gluten-free diet for at least 3 generations, orally challenged with vehicle or gliadin for 4 weeks (5 mg/daily for one week and then 5 mg/daily thrice a week for 3 weeks) in the presence or absence of intraperitoneal genistein administered 15 minutes prior gliadin challenge (n=10 mice per group of treatment). (A) Representative traces of CFTR-dependent Cl- secretion measured by forskolin (Fsk)- induced increase of chloride current (Isc (μA/cm2)) in small intestines mounted in Ussing chambers; quantification of the peak CFTR Inhibitor 172 (CFTRinh172)-sensitive Isc (∆Isc) in tissue samples (n=5-10). Means±SD of samples assayed; **p<0.001 gliadin versus vehicle, °°p<0.01 gliadin versus genistein+gliadin (ANOVA, Bonferroni post-hoc test). (B-C) Immunoblot with anti-TGM2 (B) or anti-CFTR (C) antibodies and β-actin loading control (left) and relative densitometric analysis of immunoblot (right) (n=3 independent experiments). Means±SD of triplicates of independent experiments; ***p<0.001 gliadin versus vehicle, °°°p<0.001 gliadin versus genistein+gliadin (ANOVA, Bonferroni post-hoc test). (D) Quantification of protein levels (by specific ELISA) of IFN-γ (left) and IL-15 (right). Means±SD of triplicates of independent pooled samples. ***p<0.001 vehicle vs gliadin or °°°p<0.001 gliadin vs genistein+gliadin (ANOVA, Bonferroni post hoc test). (E) IFN-γ release (ELISA) in culture supernatants by PBMC from 4 celiac patients cultured in the lower compartment of a bidimensional co-culture model upon 24 h challenge of confluent CaCo-2 cells in the upper compartment with P31-43 or P57-68 or with the combination of P31-43 and P57-68 in the presence or absence of genistein. Means±SD of triplicates of independent pooled samples. ***p<0.001, P57-68 or P31-43 vs P31-43/P57-68 combination (n=4); °°p<0.01, P57-68/P31-43 combination vs genistein+ P57-68/P31-43 (n=4), (ANOVA, Bonferroni post hoc test). Data information: The blots are representative of one experiment for group of treatment.