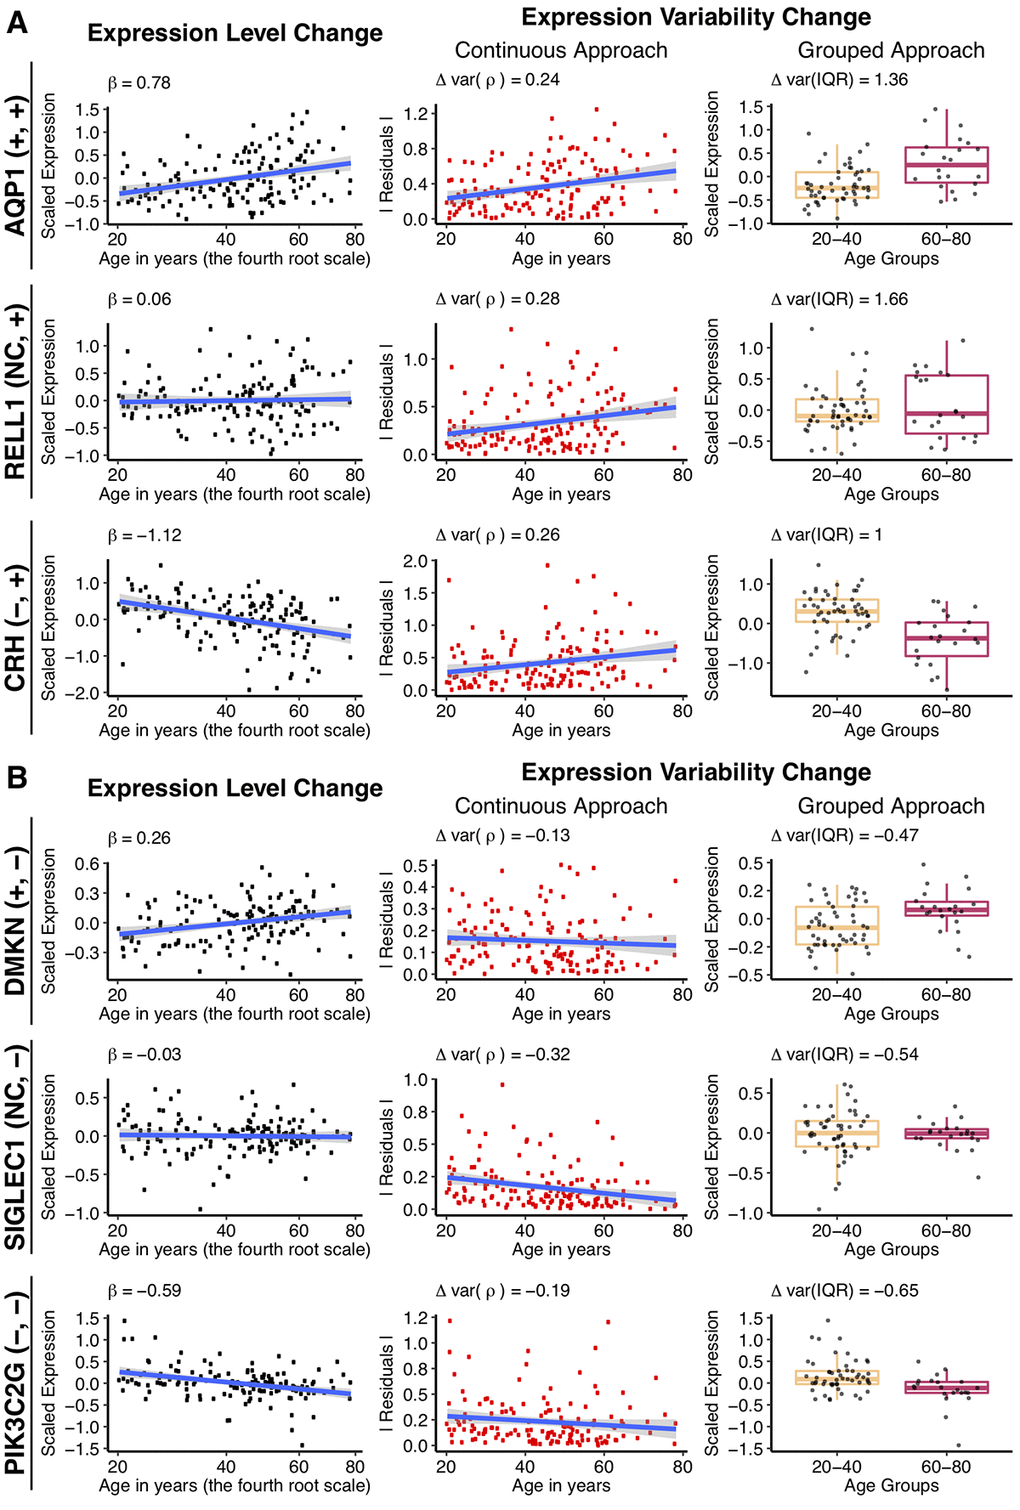
Figure 2.Changes in gene expression and its variability with age for some individual genes, using the different approaches. Example genes are chosen that increase (A), or decrease (B) expression variability with age, when the mean gene expression either increases, does not change or decreases. The types of change, for expression and variability respectively, is shown in the parenthesis following the gene name, for each row. Genes were selected to have the biggest absolute values of Δvar(ρ) and Δvar(IQR) as well as demonstrate significant increase, decrease or no change in the expression level with age. The first column to the left illustrates mean expression level (regression-corrected) plotted against individual’s age on the x0.25 – transformed scale. The regression line is colored in blue, with the β1 coefficient from the linear regression shown on the graph. The middle column illustrates the continuous approach to measure differential variability. Absolute values of the residuals (in red) from the regression line are plotted against age and the regression line between residuals and age (in blue) is drawn for illustrative purposes. The Spearman correlation estimates, Δvar(ρ) between the residuals and age are displayed on the graph and used in the subsequent analysis. The last column on the right illustrates the grouped approach to calculate differential variability. Gene expression levels (regression-corrected) of the individuals from the “young” (20 – 40 years old) and “old” (60 – 80 years old) groups are represented in the corresponding boxplots. A small random deviation (jitter) from the x-axis is applied for better visualization. Δvar(IQR), the fractional change in the variability in the “old” group, as compared to the “young”, is displayed on the graph.