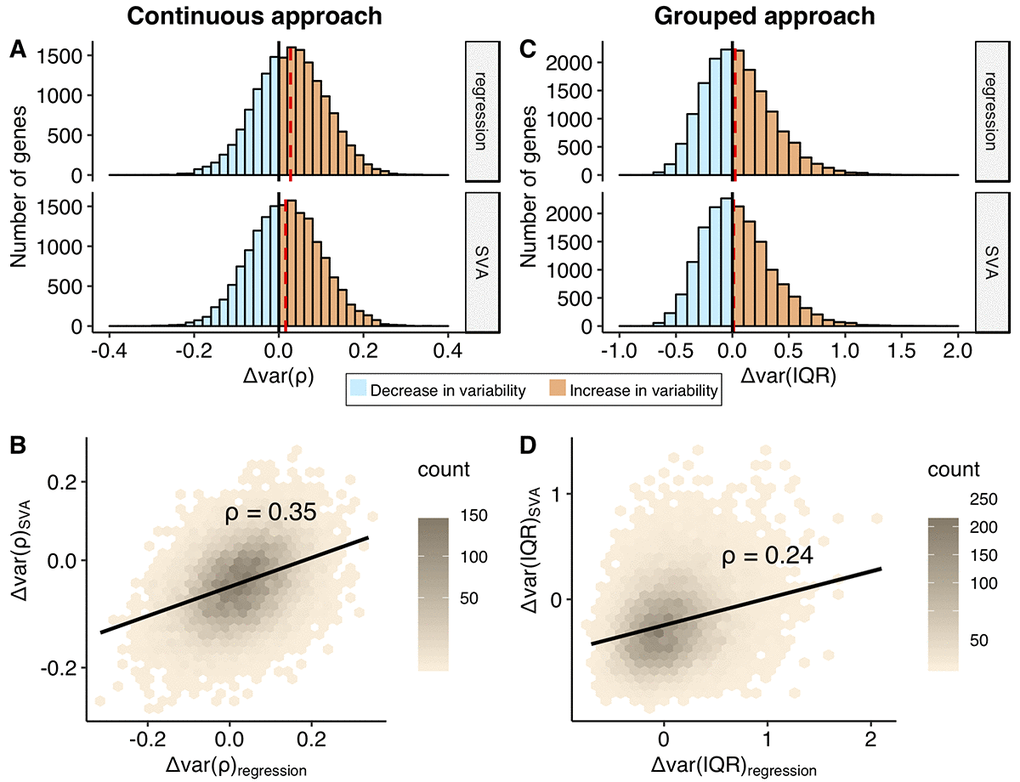
Figure 3.Comparison of the change in the variability addressed using continuous and grouped approaches, regression and SVA correction. Distributions of the Δvar-measures for all the genes (n = 16675) obtained in the continuous (A) and grouped (C) approaches. Increase in the variability with age, Δvar > 0, is colored in orange, while decrease in variability, Δvar < 0, is marked in blue. The red dashed line depicts median of the distribution. The Δvar(ρ) distributions are normal with their mean and median values equal to 0.03 and 0.02 for regression and SVA, respectively; The Δvar(IQR) distributions are moderately skewed: skewness values are 0.66 and 0.68 for regression and SVA, respectively. The mean and median values of the Δvar(IQR) distribution are 0.05 and 0.02 for regression and 0.04 and 0.01 for SVA, respectively. Hexagonal heat maps illustrate relationship between regression and SVA-corrected measures of the variability for each gene, obtained in continuous - Δvar(ρ) (B) and grouped - Δvar(IQR) (D) approaches. The color gradient represents the density of the data. The linear regression line and the Spearman correlation estimate, ρ, for the corresponding variables are shown on each graph.