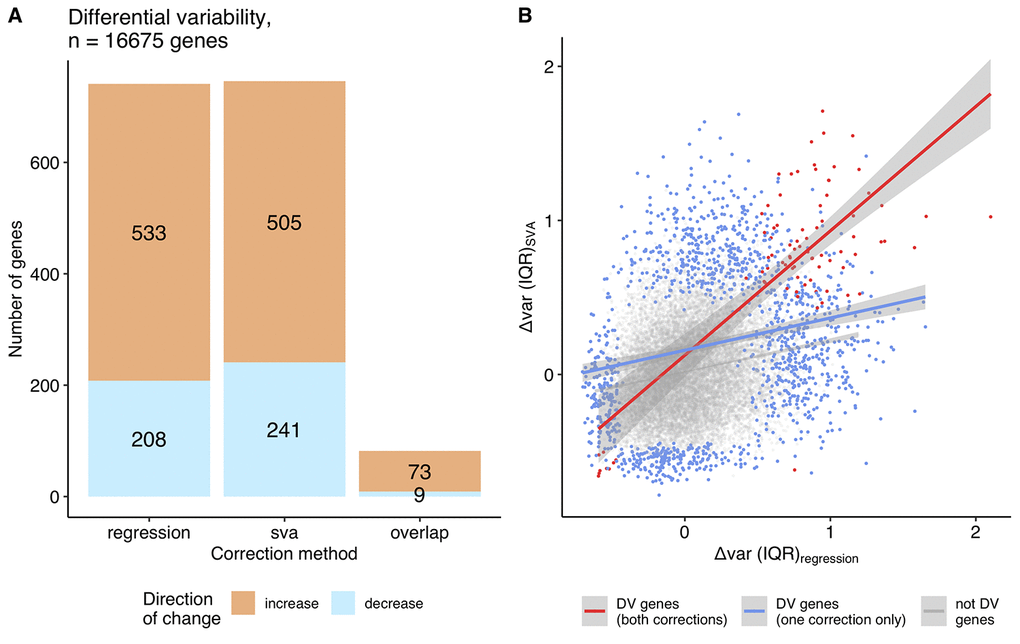
Figure 4.Differentially variable genes (grouped approach). (A) A bar plot of the differentially variable genes in aging identified using the grouped approach (regression, SVA correction and their overlap), direction of the change in the variability is shown in color: orange - increase in variability in aging, blue – decrease in variability (The single common gene, which shows inconsistency between approaches, is not displayed on the graph). (B) The relationship between the variability measures calculated using the grouped approach, Δvar (IQR), for regression and SVA-corrected data. Differentially variable (DV) genes identified in both corrections are highlighted in red (Spearman ρ = 0.44); DV genes identified in either regression, or SVA - in blue (Spearman ρ = 0.20); genes, that were not found to be differentially variable in any of the approaches – in grey (Spearman ρ = 0.20).