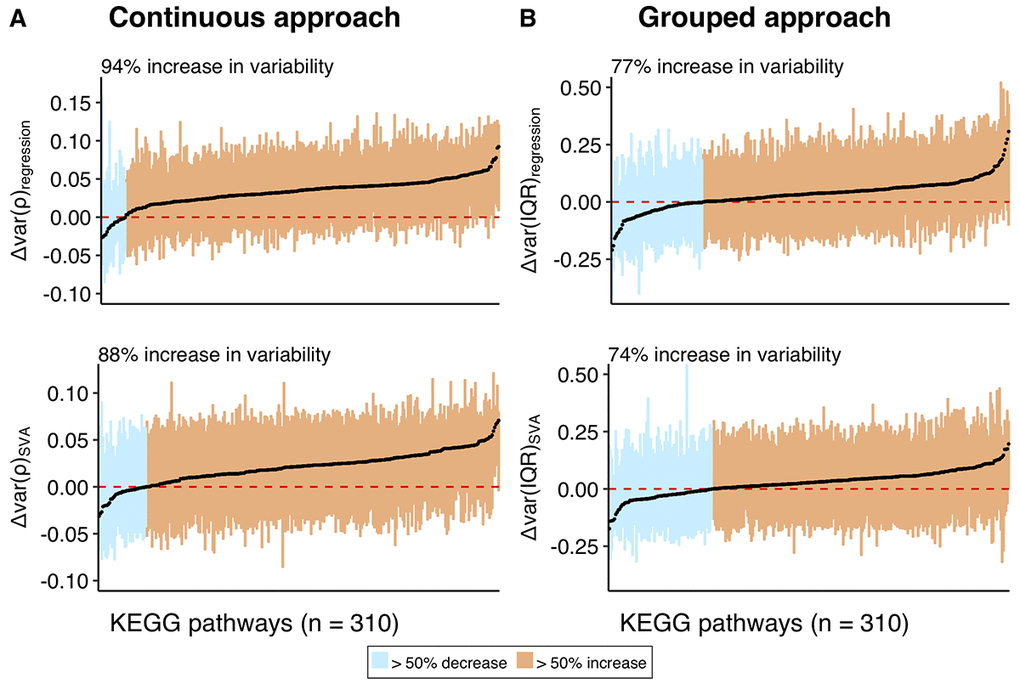
Figure 5.Distributions of the variability measures (Δvar) obtained using a combination of continuous and grouped approaches with regression and SVA-correction for the individual pathways in KEGG database. The distribution of the variability measures (Δvar) for the genes within each pathway is represented as a box, encapsulating part of the distribution between 1st and 3rd quantile, median of the box is colored in black. (A) represents variability measure distributions for the continuous, while (B) for the grouped approaches. Pathways on Y-axis and corresponding them boxes are ordered by increasing median. Boxes are colored in orange if the corresponding pathways have median Δvar > 0, and in blue, if median Δvar < 0. Text label on the plot shows percentage of pathways with median Δvar > 0. Red dashed line marks Δvar = 0, while black straight-line marks median across all the pathways. The mean values for the median across all pathways are 0.033 for Δvar(ρ)regression, 0.021 for Δvar(ρ)SVA, 0.033 for Δvar(IQR)regression, and 0.027 for Δvar(IQR)SVA.