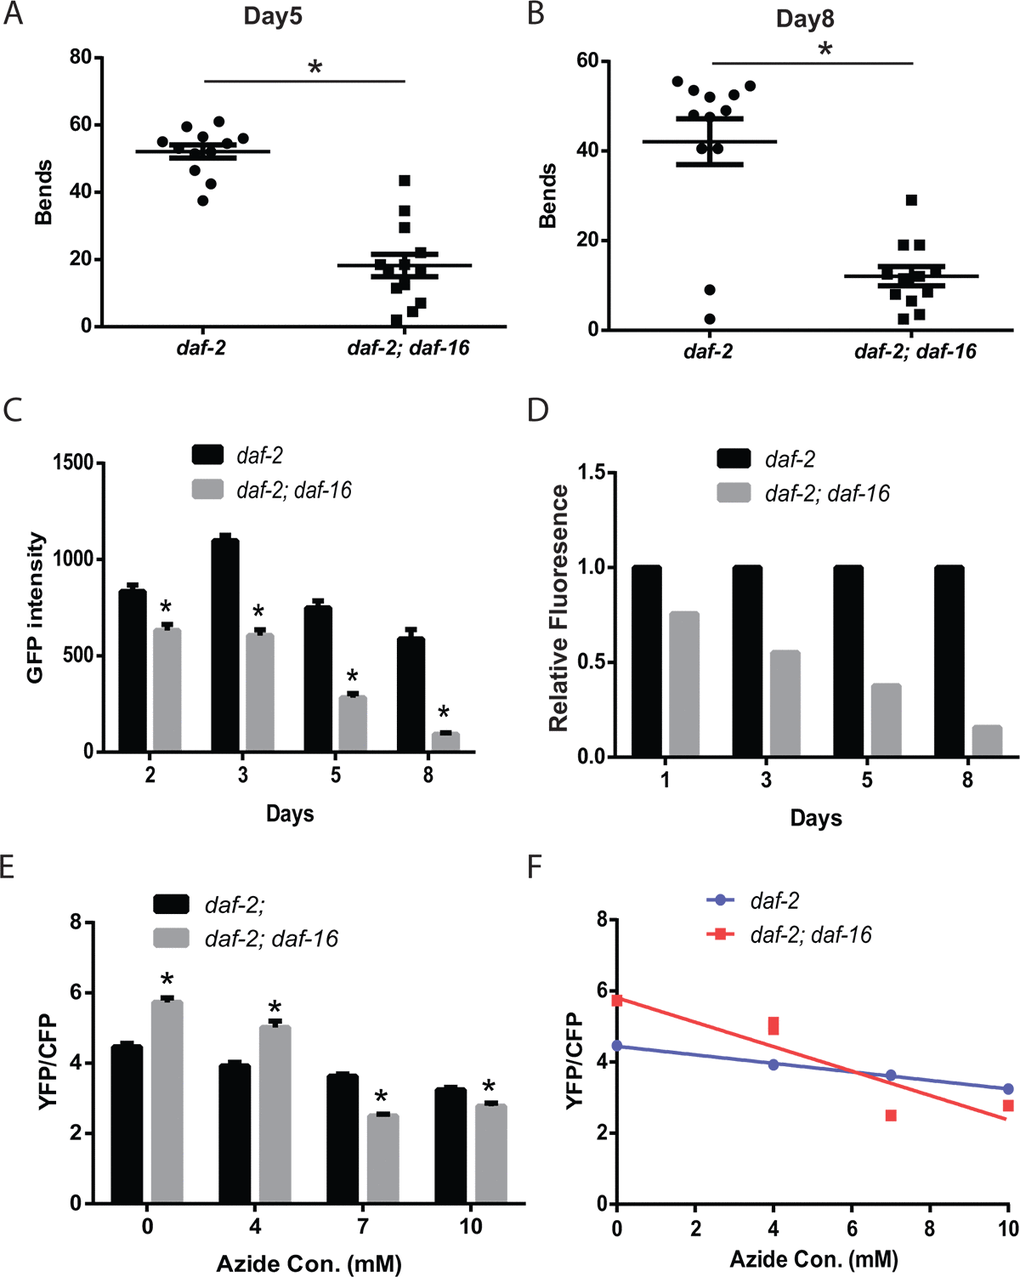
Figure 3.The daf-2 mutants exhibit daf-16-dependent increases in muscle function and mitochondrial mass.daf-2 mutant animals exhibit increased thrashing behavior in liquid, compared to daf-2 daf-16 mutants, as shown by the measurement of the number bends during a 30 second period on either adult day 5 (A) or day 8 (B). N = 12 for both genotypes and ages. * represents p < 0.05 by t‐test. (C) The daf-2 daf-16 mutants show a lower mitochondrial mass and larger age-related decline as shown by the digital imaging and quantitation of animals expressing a mitochondrial-localized GFP. N >12 for all genotypes and ages. * represents p < 0.05 by t‐test. The declines in mitochondrial mass are particularly evident when the data in (C) is replotted to set the daf-2 fluorescence on each data to 1.0 (D). (E) The daf-2 daf-16 mutants show less mitochondrial reserve when activity is reduced by treatment with the mitochondrial inhibitor sodium azide as shown by the imaging of the ATeam ratiometric reporter. Each bar represents the ATeam YFP/CFP ratio from daf-2 or daf-2 daf-16 mutant animals treated with the indicated concentration of sodium azide. N = 60 - 70 worms per genotype and treatment. * represents p < 0.05 by t‐test. (F) The differing declines in muscle ATP levels produced by the azide treatment can also be seen when the data from (E) is replotted as an X-Y graph.