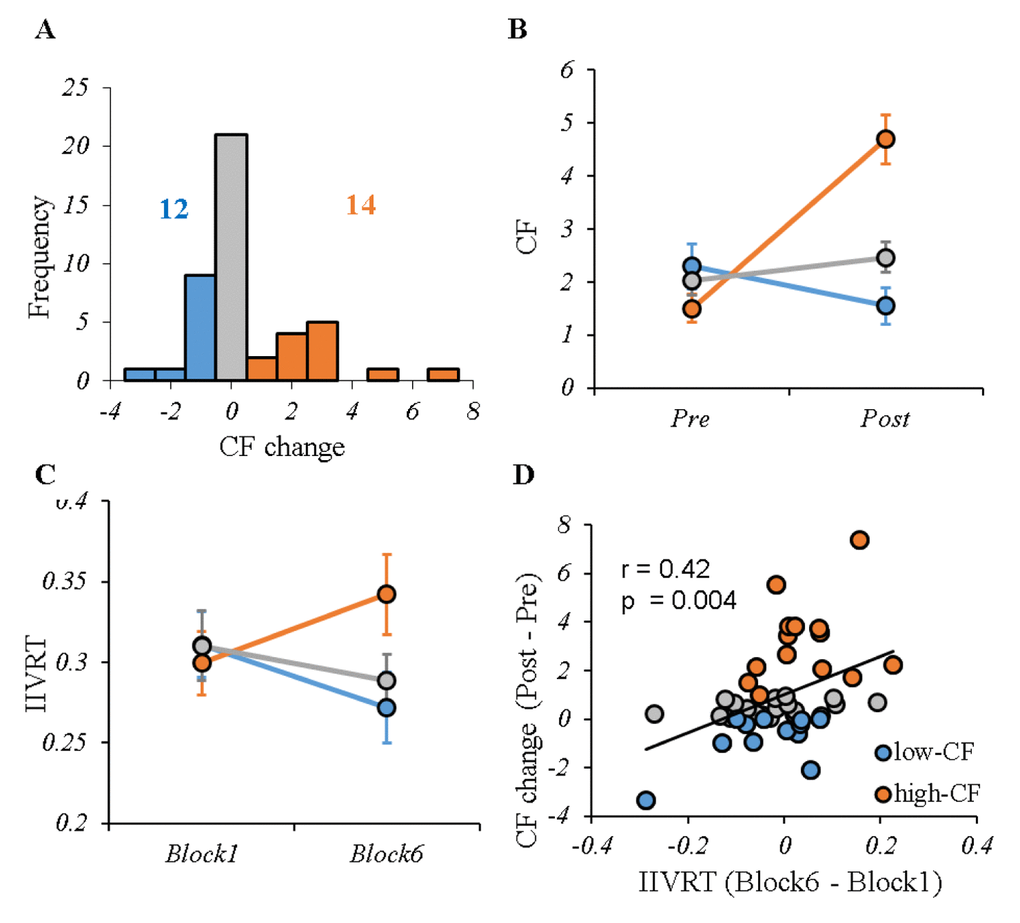
Figure 2.CF profile for the entire sample. (A) The distribution of CF change (post-pre) induced by cognitive tasks during fMRI scanning. According to different perceived fatigue, two groups were selected: low-CF subgroup (12 subjects with CF change ≤ 0, shown in blue) and high-CF subgroup (14 subjects with CF change ≥ 1, shown in red). In addition, there were 20 subjects outside the high- or low-CF subgroups (shown in grey). (B) The VAS fatigue score before and after performing cognitive tasks for each group, showing significant difference between high- and low-CF subgroup. (C) The IIVRT in Block1 and Block6 for each group showed the performance change with time by CF subgroups. There were significant different trends in IIVRT change between high- and low-CF subgroup. (D) Higher CF was significantly associated with larger IIVRT change (worse cognitive performance). Note: CF, cognitive fatigue; IIVRT, intra-individual variability of reaction time. low-CF subgroup: blue; high-CF subgroup: red; others: gray.