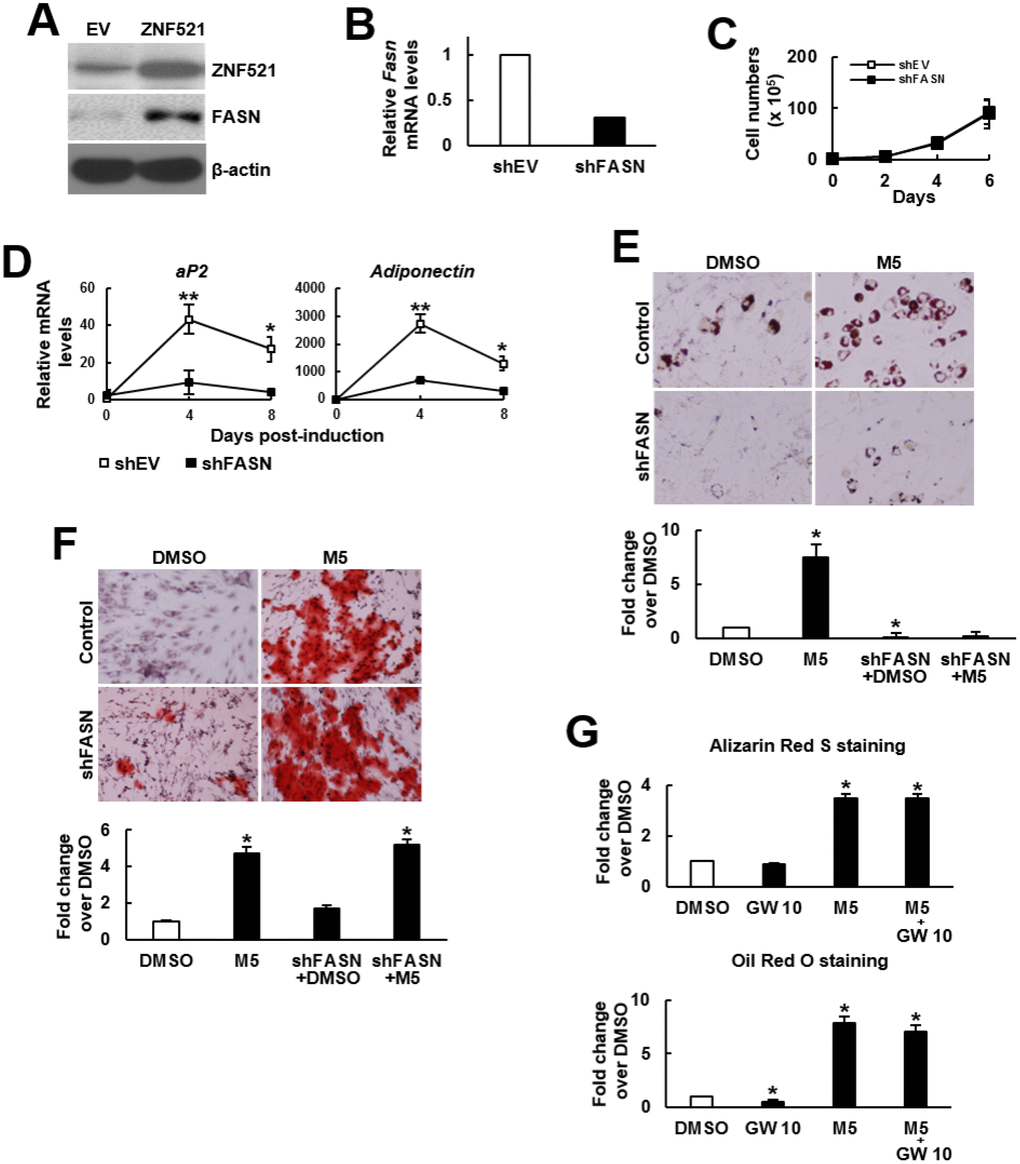
Figure 4.Effect of MCC-555 plus FASN knockdown or GW9662 on the adipogenic and osteoblastic differentiation of C3H10T1/2 cells. (A) Western blot analysis. ZNF521 overexpression induced FASN expression in C3H10T1/2 cells. (B) RT-qPCR analyses showed the Fasn mRNA levels of control (shEV) and FASN-knockdown (shFASN) cells. (C) Cell proliferation assays. shEV and shFASN cells were seeded (1 x 10⁵/plate) and counted at the time indicated. Data represent the mean ± S.D. from three experiments. (D) RT-qPCR analyses. Confluent shEV and shFASN cells were induced to undergo adipogenic differentiation, the expression kinetics of aP2 and adiponectin mRNAs were examined at the times indicated. *, P<10-5; **, P<10-6 versus counterpart shEV control. (E) Adipogenic induction. Confluent shEV and shFASN cells were induced to undergo adipogenic differentiation. The cells were co-treated with 5 μM MCC-555 or DMSO in the first 3 days. Cells were stained with Oil Red O at the 8th day. Representative photos are shown. The stains were quantitated, and the signals of the MCC-555-treated cells were compared to that of the DMSO control cells (to which a value of 1 was assigned). One-way ANOVA plus Scheffe’s post hoc tests were used to analyze the differences. *, P<0.05 versus the DMSO-treated cells. (F) Osteoblastic induction. Confluent shEV and shFASN cells were induced to undergo osteoblastic differentiation. The shEV cells were co-treated with either 5 μM MCC-555 or DMSO, whereas the shFASN cells were co-treated with 5 μM MCC-555. Cells were stained with Alizarin Red S at the 28th day. Representative photos are shown. The stains were quantitated, and the signals of the MCC-555-treated cells were compared to that of the DMSO control cells (to which a value of 1 was assigned). One-way ANOVA plus Scheffe’s post hoc tests were used to analyze the differences. *, P<0.05 versus the DMSO-treated cells. (G) Confluent C3H10T1/2 cells were induced to undergo osteoblastic (upper) and adipogenic (lower) differentiation. Osteoblastic induction was accompanied by co-treated with DMSO, MCC-555 (5 μM), GW9662 (10 μM), or MCC-555 plus GW9662 (M5+GW10), whereas adipogenic induction was accompanied by those co-treatments in the first 3 days. Cells were stained with Oil Red O at the 8th day or with Alizarin Red S at the 28th day. The stains were quantitated, and the signals were compared to that of the DMSO control cells (to which a value of 1 was assigned respectively). One-way ANOVA plus Scheffe’s post hoc tests were used to analyze the differences. *, P<0.05 versus the DMSO-treated cells.