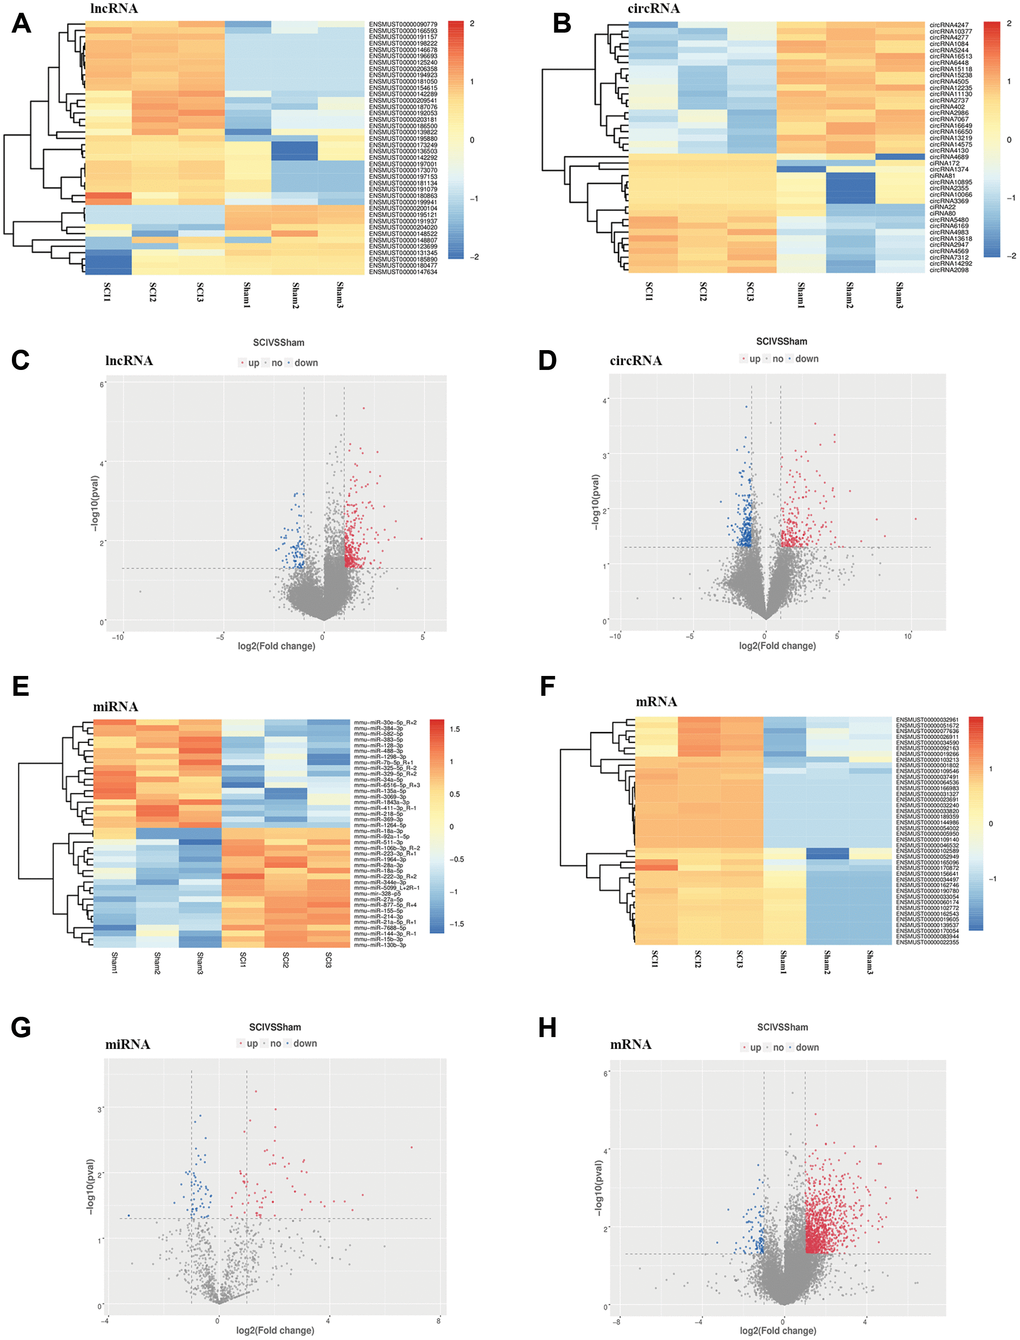
Figure 2.Expression profiles of DE ncRNAs and mRNAs in the lesion epicenter after SCI. (A) Heat map of DE lncRNAs in the SCI group compared with the sham group. (B) Heat map of DE circRNAs. (C) Volcano plot indicating the differential expression of lncRNAs. (D) Volcano plot of circRNAs. (E) Heat map of DE miRNAs. (G) Volcano plot of miRNAs. (F) Heat map of DE mRNAs. (H) Volcano plot of mRNAs. Up-regulated and down-regulated genes are colored in red and blue, respectively.