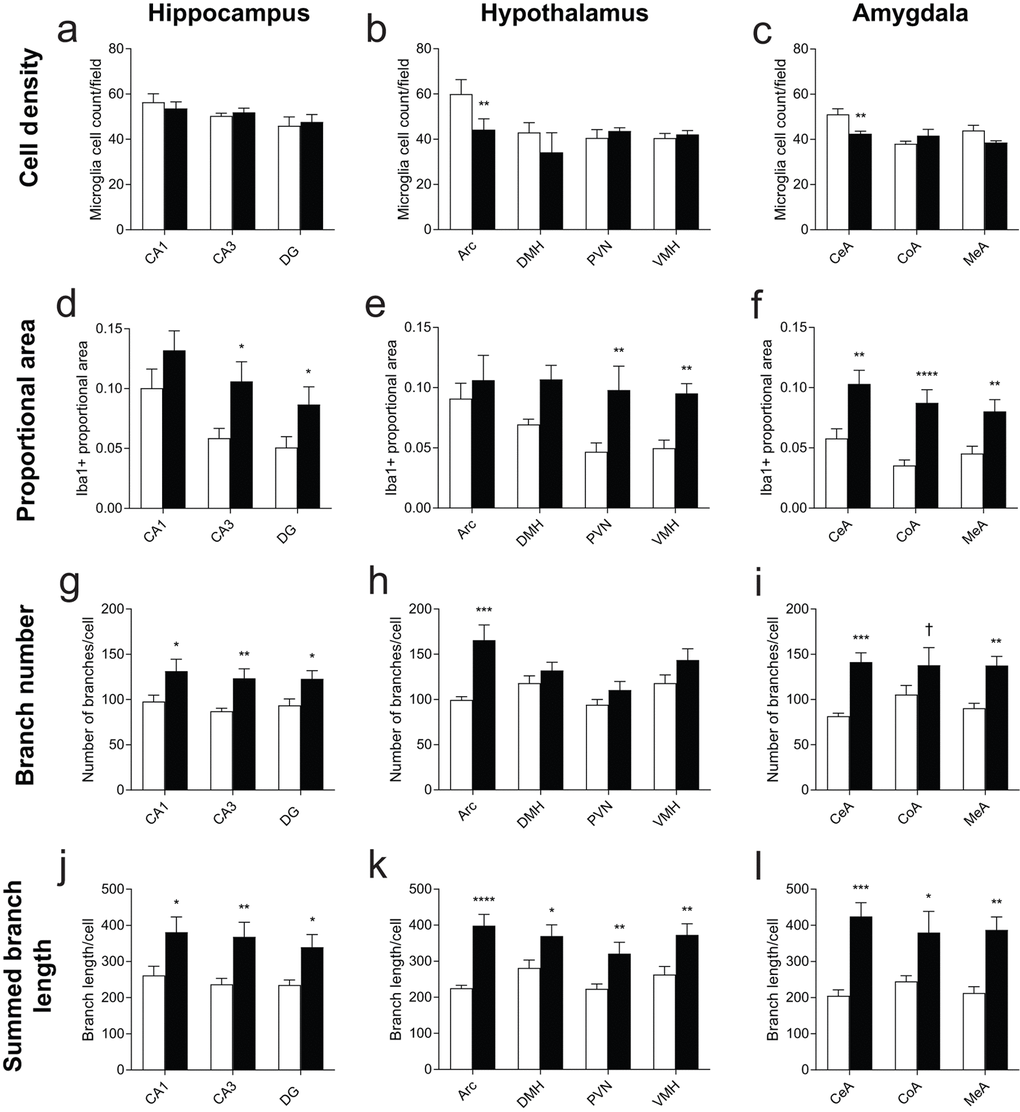
Figure 5.Morphology measurements across hippocampus, hypothalamus, and amygdala nuclei. (a-c) Cell density measures from nuclei within the (a) hippocampus, (b) hypothalamus, and (c) amygdala from fields of approximately 0.187 mm2. In (b), Arc is adjusted to represent the density of cells in Arc given an equivalent field area. (d-f) Iba1 positive-staining proportional area. (g-i) Skeleton branches counted from fields of each nucleus. (j-l) Total branch length from fields of each nucleus. n=4 for SE, 5 for EE. *p<0.05, **p<0.01, ***p<0.001, ****p<0.0001, †p<0.06. Values are means ± SEM. For statistical summary, see Supplementary Table S1.
Figure 5 — Long-term environmental enrichment affects microglial morphology in middle age mice | Aging